Category Archives: Technical Lake Stuff

Midsummer Water Quality Update

Clary’s water quality this summer is in a word, awesome. I’m sure  any of you who’ve been swimming will agree! The clarity so far this summer is measurably better than we’ve seen in a long time. Last weekend on July 14th Kelsie French and I went out for our biweekly water quality monitoring session at the “deep hole” and we both had secchi disk readings of 4.81 meters (15.77 feet). This is the deepest secchi disk reading we’ve recorded since a 4.88 meter (16.00 feet) reading back in May 2003 (see chart at left). There have been less than 10 secchi disk readings as good or better than today’s, going back to 1975, and none in the last 20 years. Extraordinary. Today’s secchi disk reading was actually the 5th consecutive reading deeper than 4 meters, also extraordinary. We haven’t had a stretch of clear summer water like this in Clary Lake for a long time. Continue reading

June 2024 Water Level Chart Archived

6 Clary-Lake-Water-Level-June-2024I have archived the June 2024 water level chart (above, and at left). June was a dry month, until it wasn’t. Things were getting pretty dry by the 19th of the month, having received only 1.15 inches of rain up to that point. Then the sky opened up! Over the next 10 days we received an additional 6.90 inches or rain bringing us to 8.05 inches for the month, making June the second rainiest month of the year so far, only inch and a half behind March (see chart below). This brings us to 32.11 inches for the year, close to a foot more than normal. The lake level, which had been gently falling for the first 20 days of the month, spiked at 0.15 feet ABOVE the HWM on June 25th, flooding a few docks around the lake and making many others perilously close to flooding- including mine. Only some hasty gate adjustments kept the lake from getting even higher. It’s not that we were caught napping, the problem was that the three biggest rain events, while anticipated, far exceeded the forecast amount of rain.

Outflows from Clary Lake in 2024 (chart at left) remain the highest of the previous 5 years, though 2023 flows are not far behind. To date, 1.6 lake volumes of water have passed through the lake and headed downstream to the Sheepscot River. Keep in mind that the published ANNUAL flushing rate for Clary Lake is only 1.8 lake volumes and with the year only about half over, we’re almost there already. It is pretty clear that we’re going to exceed that published figure this year, perhaps by a lot. The impact of all this flushing on our lake water quality still remains to be seen. There are some indications and some historical evidence to suggest that a high flushing rate good thing. Normally however, high outflows imply high inflows which usually bring sediment, Phosphorus, and other nutrients into the lake, feeding algae growth. So far this year however, lake transparency has remained high: our last secchi disk reading on June 16th was 4.73 meters (15.5 feet) which is very good for early summer, and much better than this time last year. It is however still early in the summer season but for now, it’s looking good.


May 2024 Water Level Chart Archived

5 Clary-Lake-Water-Level-May-2024I have archived the May 2024 water level chart (above, and at left). May’s rainfall was more or less normal for a change, we received 3.55 inches of rain, only 0.16 inches less than the normal 3.71 inches. This allowed things to dry out a bit and resulted in a very stable water level right around or slightly above the top of the dam for most of the month.  The biggest rain storm of the month occurred on the 27th and 28th of May, dropping a total of 1.35 inches of rain and gently pushing the lake level to just 0.01 feet shy of the “official” HWM elevation (established by DEP back in 2014) of 151.17 feet. I consider the “practical” HWM to actually be 0.22 feet lower, at 150.95 feet (which we’ve adopted from the USGS National Map, see below) which is effectively at the top of the dam; at that elevation, there’s just a wee bit of water dribbling over the dam in a couple of spots, as you can see in this chart from May 5th when the water level was at 150.95 feet: Continue reading

Lake Water Quality Monitoring Resumes for 2024

Kelsie French and I resumed our water quality monitoring efforts for 2024 on Sunday May 5th, a little earlier than in recent years. The lake is still largely homogenous with a surface temperature of 13.3°C (55.9°F) and 11.2°C at 8 meters. Surface DO was 11.3 mg/L and 8.4 mg/L at 8 meters. The Secchi disk reading was 3.55 meters (11.6 feet) which I guess is about normal for this time of year, but nothing to write home about. You can see where it lands on the chart at left (the sole data point, far to the right, in the 2024 column right below the red trendline). You can see a subset of water quality data including transparency going back to 2001 on our Clary Lake Water Quality Monitoring Data page. Today the water was kind of murky. Despite being early in the season, there’s already phytoplankton, primarily diatoms, populating the lake. As the water warms up, the diatoms will mostly die off to be replaced by green and blue-green algae later in the season. It’s really the blue-green algae (Cyanobacteria) that we’re worried about. Blue-green algae is mostly a late summer and fall phenomena. Continue reading

April 2024 Water Level Chart Archived

4 Clary-Lake-Water-Level-April-2024I have archived the April 2024 water level chart (above, and at left). April was another wet month, though not nearly as wet as March had been: we received 4.62 inches of rain, 3/4 of an inch more than the 3.87 inches we’ve received in a “normal” year, whatever that means. Most of that rain fell by the 12th of the month, only a little over a half inch fell during the rest of the month. This allowed the ground was to dry out a bit. For the year we’re at 20.58 inches of precipitation, a little more than 7 inches above average for this date. This bodes well for ground water supplies later this summer. All this water has kept the lake level generally higher than we like: March actually ended with the lake level 0.31 feet above the High Water Mark or fully 6 inches ABOVE the lowest spot on the top of the dam. When the lake is that high, there is a real risk of shoreline erosion in areas around the lake that are not protected by a rocky shoreline. However, managing the dam to maintain a specific lake level is a real challenge and the response to a change in gate opening or weir height can be maddeningly slow. It’s too easy to over shoot the mark, or fall short of it. Therefore, we try to avoid large gate and weir adjustments and take some time to bring the lake level up or down where we want it. Continue reading

March 2024 Water Level Chart Archived

3 Clary-Lake-Water-Level-March-2024

March 2024

I have archived the March 2024 water level chart (above, and at left). The dearth of precipitation we saw in February did not continue into March. On the contrary, we ended up with 10.72 inches of precipitation making March 2024 the second wettest March on record, only slightly behind the 11.24 inches received in March 2010. “Normal” March precipitation in this area is around 3.77 inches but we received more than 2.8 times more than that. Even with the lack of rainfall we saw in February, we end the month with nearly 7 inches more annual precipitation than is normal for this date. March was also warmer and windier than usual which resulted in Clary’s ice cover melting off on March 8th, the earliest we’ve recorded since record keeping started in 2001. Continue reading

February 2024 Water Level Chart Archived

2 Clary-Lake-Water-Level-February-2024

February 2024

I have archived the February 2024 water level chart (above, and at left). There was virtually no precipitation to speak of in February until the last 2 days of the month when we received a total of 1.16″ of rain! We ended the month with only 1.35 inches total, or only 52% of the normal 2.61 inches. On average, February has the least amount of precipitation of all 12 months. Despite the lack of precipitation, the lake level actually fell quite slowly over the course of the month losing only 0.36 feet all month while outflows remained quite high, thanks to January’s excessive rainfall. In fact, for much of the month of February total outflows in acre-feet exceeded those in 2023 which is amazing considering how little precipitation we received. By the end of the 3rd week of February however, outflows had fallen behind 2023 numbers and the lake level finally reached -1.5 feet. With slowing outflows, we decided it was time to add some stoplogs to the weir. The rainfall at the end of the month brought the lake up 4 tenths of a foot, ending the month at -1.09 feet or about average for the end of February. I expect the lake will rise a little more in the  next couple of days. Continue reading

January 2024 Water Level Chart Archived

1 Clary-Lake-Water-Level-January-2024

January 2024

I have archived the January 2024 water level chart (above, and at left). With an average monthly precipitation of 3.19 inches, January is normally the least wettest month next to February which averages only 2.61 inches of precipitation, usually in the form of snow. This year however we received 3.82 inches or water or 120% of our normal precipitation on top of the whopping 16″ of surplus rainfall we received in 2023. We had to release a lot of water in January from surface runoff from rain and snow melt and also from ground water to keep the lake level down where it belongs this time of year.  We still had water overtopping the dam when the lake rose to within a tenth of a foot of the high water mark on January 14th, an unusual circumstance in January. Continue reading

December 2023 Water Level Chart Archived

12 Clary-Lake-Water-Level-December-2023And that’s a wrap! I have archived the December water level chart (at left and above) bringing 2023 to a close. Once again as has happened so often this past year, December rainfall vastly exceeded the monthly average. We received 7.47 inches of rain in December, 4.03 inches more than the average of 3.44 inches. We ended the year with a total of 60.31 inches of precipitation, 16.25 inches more than the annual average of 44.06 inches. To say it was a wet year doesn’t quite do it justice: we got soaked in 2023! All this rain resulted in some wild swings in the lake level in December with it twice rising above the High Water Mark resulting in gentle overtopping of the dam. This isn’t actually all that unusual. Despite our efforts to keep the lake level “down where it belongs” going into Winter, over-topping in December happens roughly 3 years out of 5. Continue reading

November 2023 Water Level Chart Archived

11 Clary-Lake-Water-Level-November-2023

November 2023

I have archived the November 2023 water level chart (above, and at left). November is normally the wettest month of the year with average rainfall of 4.58 inches but this year we fell a little short, receiving only 3.24 inches of rain with most of it falling in the latter half of the month. However, we’ve already received 52.84 inches of precipitation this year so we’re way ahead of the average of 40.62 inches of rainfall for November. As it stands now, 2023 will be a record year for precipitation even if we don’t get any more rain (or snow) between now and the end of the year.

Total Phosphorus In Clary Lake

[November 2023] I’ve been working on this article about Total Phosphorus levels in Clary Lake for some time, another in our continuing education series, based on the premise that informed people make better Lake Stewards! The better we all understand lake science the better able we will be to protect and preserve our cherished natural resource. This article on Phosphorus in Clary Lake will be posted under Programs.

Total Phosphorus In Clary Lake

Clary_Total_PhosphorusPhosphorus (P) is an element on the Periodic chart and it exists in nature in rocks and soil in various forms. P is crucial to all life forms and in small amounts it is a good thing, but as you’ve all learned by now, too much P can cause excessive algae growth resulting in harmful algal blooms. Consequently, an important part of our Water Quality Monitoring program is collecting data on the Total Phosphorus (TP) load in Clary Lake, and studying how it varies over time (TP is a measure of ALL the phosphorus found in a sample whether it is dissolved or in particulate form). We take 3 water samples for TP testing every season, and our 3rd and final TP test result for 2023 is back so this seems like good time to dig into this important topic. On September 22nd we took a 7 meter core water sample; it came back showing 0.017 mg/L of TP. I was actually expecting a higher figure in the mid to upper 20s and I’m glad I was wrong, but clearly it was high enough to fuel a moderate month-long algal bloom this fall with sightings of dead green algae collecting along the shore as early as late September and as recently as the end of October. The blessing if there is one is that it didn’t happen during the summer! Last year we had generally higher TP readings and a much more severe algal bloom that started around September 1st and didn’t burn itself out until late November. Other factors do contribute to produce algal blooms, but the presence of Phosphorus (P) in our lake is the single biggest cause. When we say algal blooms, we’re mainly talking about excessive growth of blue-green algae, more commonly known as Cyanobacteria. We’ll cover Cyanobacteria in depth at another time. Continue reading

October 2023 Water Level Chart Archived

10 Clary-Lake-Water-Level-October-2023I have archived the October 2023 water level chart (above, and at left).  Rainfall for the month once again exceeded normal (a common refrain this year!) keeping the lake level higher than intended, at one point coming within almost an inch of the HWM with water flowing over the dam- unusual in October. By the end of the month however the lake was back down to 3/4 of a foot  below the HWM which is about normal for this date. All told we received 5.36 inches of rain (normal is 4.45 inches) bringing us to 49.6 inches for the year, fully 13.6 inches above normal! Even if rainfall remains normal or below normal for the rest of the year, 2023 will still go down in the record book as an exceedingly wet year. We’ve seen greater-than-average rainfall in 7 of the first 10 months of 2023, and normally the wettest month of the year, November, is about to start. Continue reading

Fall 2023 Clary Lake Algal Bloom

IMG_3580_compressedWhile it doesn’t appear quite as severe as last fall (at least not yet), this fall’s cyanobacteria algal bloom is gathering steam. This is not wholly unexpected: our last lake transparency reading was only 2.7 meters (8.8 feet) and there was quite a bit of green algae in suspension (see 2023 Water Quality Monitoring Season Comes to a Close) so I’m not really surprised to see this. The picture at left was sent to me yesterday afternoon by Danny Bell. Quite a shot! Apparently the aquatic growth helped keep the algae from drifting off. I went down to my shoreline and found only a thin greenish sheen of algae on the surface- nothing to compare with what Danny was seeing. The blue-green bacteria dies and floats to the surface where it’s moved around by wind and currents and in some places you’ll see quite a bit of green and in others much less or even none.  Last year the bloom continued into early December. Hopefully this one will burn itself out soon. I will be sending a sample into DEP for testing.

IMG_7484001This picture was sent to my wife this morning by Fran Marsh who was understandably concerned.

Please send me your observations and pictures!

2023 Water Quality Monitoring Season Comes to a Close

20230805_140727
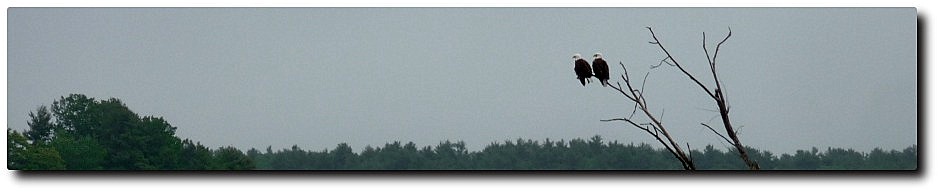
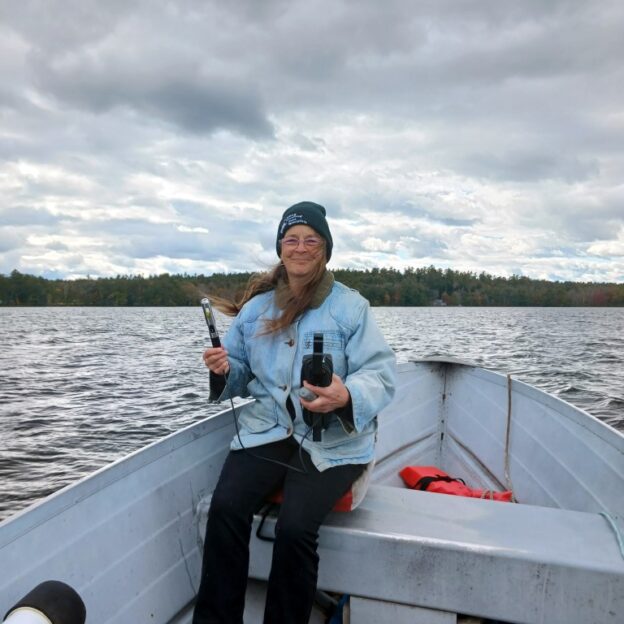
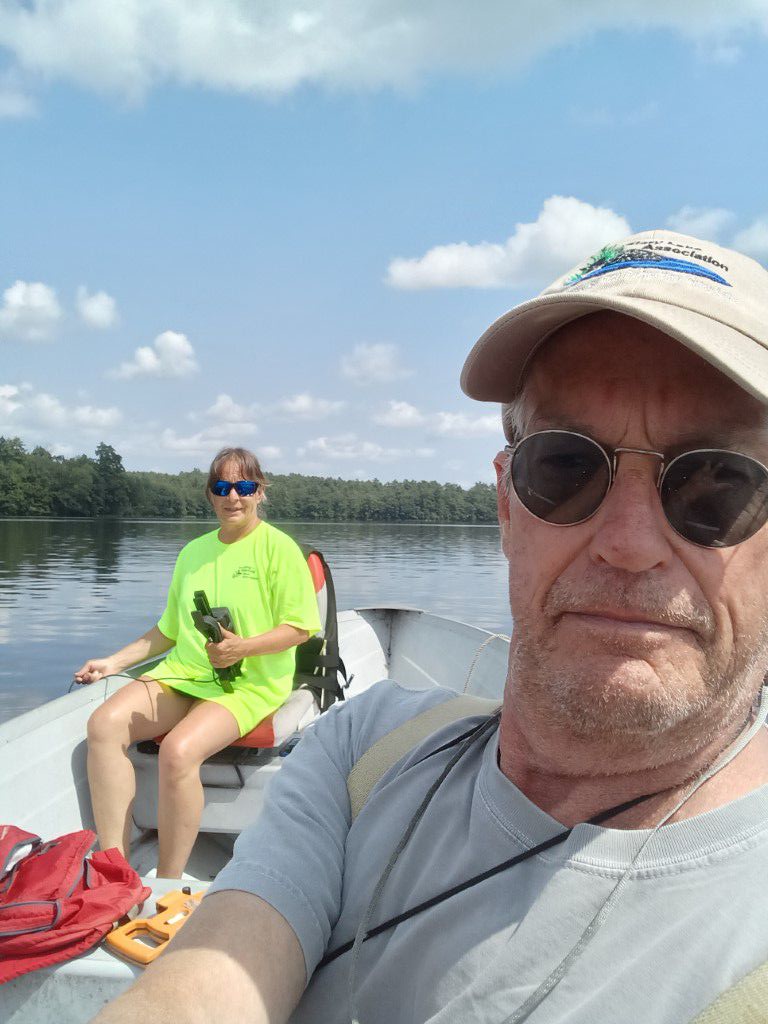
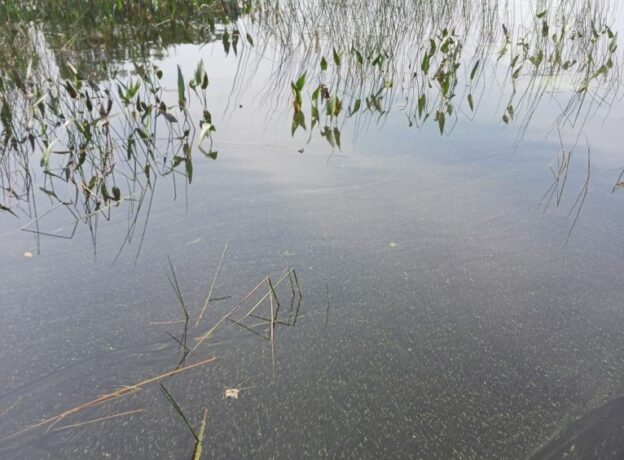
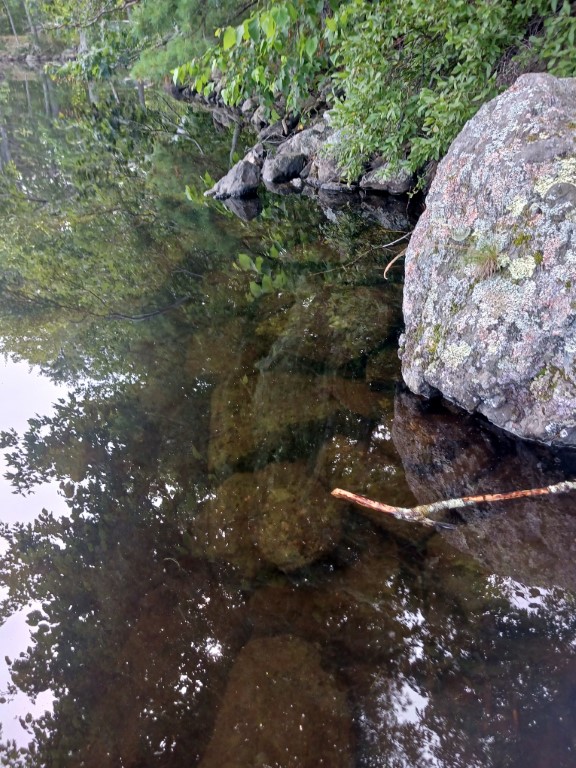
On Friday afternoon, October 13th, Kelsie French and I wrapped up another season of water quality monitoring on Clary Lake. Started by my father Stuart Fergusson and David Hodsdon back in 1975, this marks the 48th year quality data data has been collected Clary Lake one of the longest monitored lakes in Maine. It’s not summer anymore and the last day on the lake is typically cold, raw, and windy. This one was no exception as the above picture of Kelsie French (getting an air temperature reading) suggests! The weather wasn’t near as bad as we’ve experienced before, not by a long shot. We do prefer days more like the picture at left, taken back in August.

We were a little late getting started this spring thanks to a bad cable on our YSI Pro 20 Dissolved Oxygen meter which we purchased new in 2013. The new cable cost $390 and didn’t arrive until early June. Consequently, our first data collection session on the lake wasn’t until June 11th. We usually like to start in late April or early May.

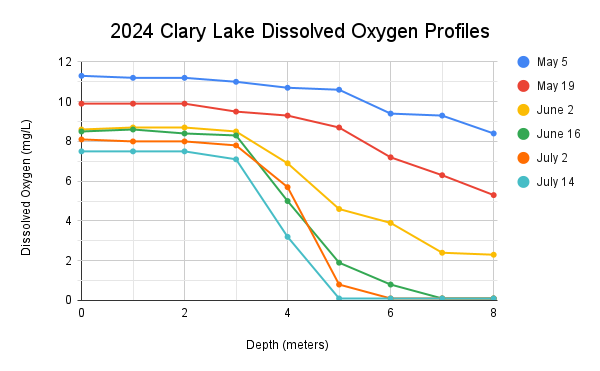
It isn’t simply cold weather that brings our water quality monitoring season to a close, it’s the fact the lake has “turned over” meaning the lake water is now thoroughly mixed from top to bottom. The lake basically goes into “rest” mode for the winter and most biologic activity winds down and becomes dormant for the winter. Soon the lake will freeze over (to learn more about that process, see this page on Ice Berms & Pressure Ridges). During Friday’s data collection session we observed surface dissolved oxygen and temperature readings of 8.5 mg/liter and 16.7°C (62°F)  and near the bottom at 8 meters it was little different (8.4 mg/liter of dissolved oxygen and a temperature of 16.5° C). Once turnover happens in the fall, there is little reason to continue with water quality monitoring. The season is over. We’re still waiting on the results of our last Total Phosphorus test sample taken on September 22nd. I’ll post them on the Clary Lake Water Quality Monitoring data page when it arrives; I expect it will be higher than normal due to the fall turnover.

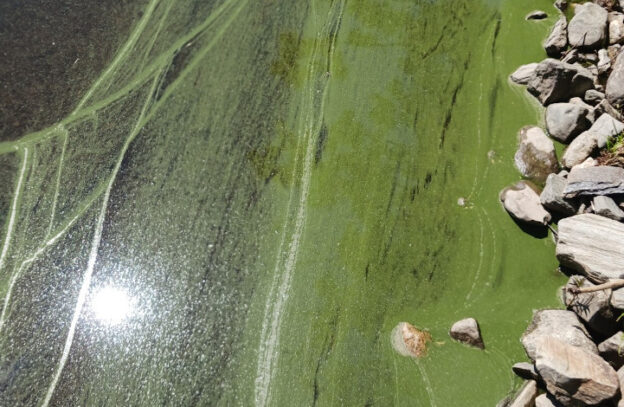
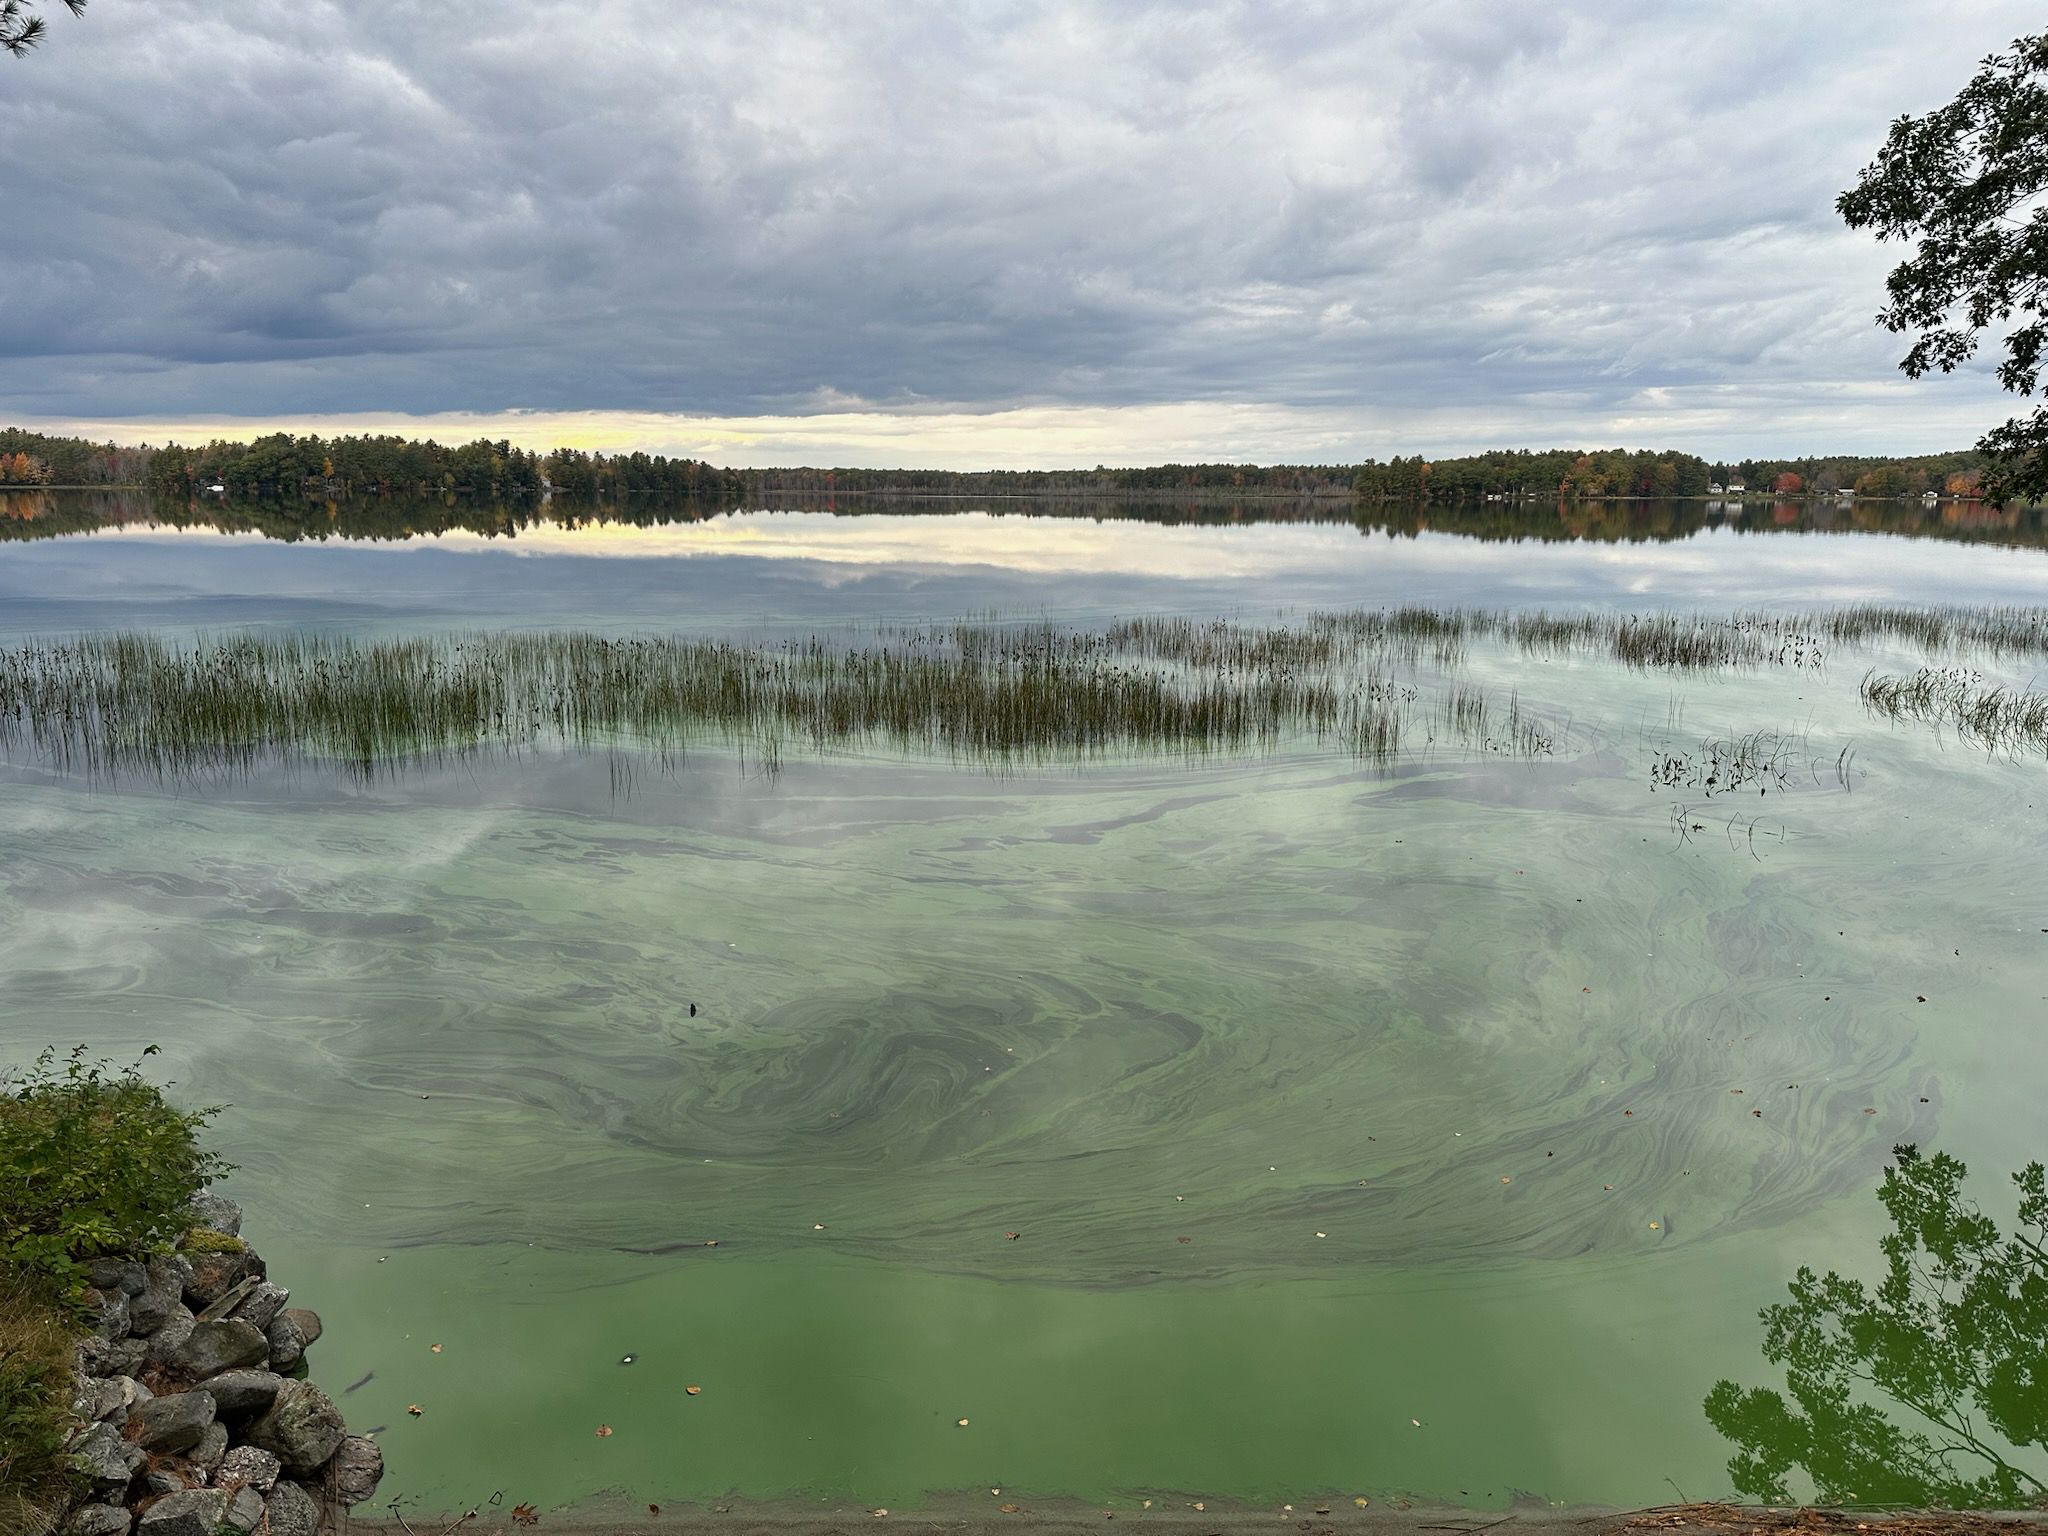
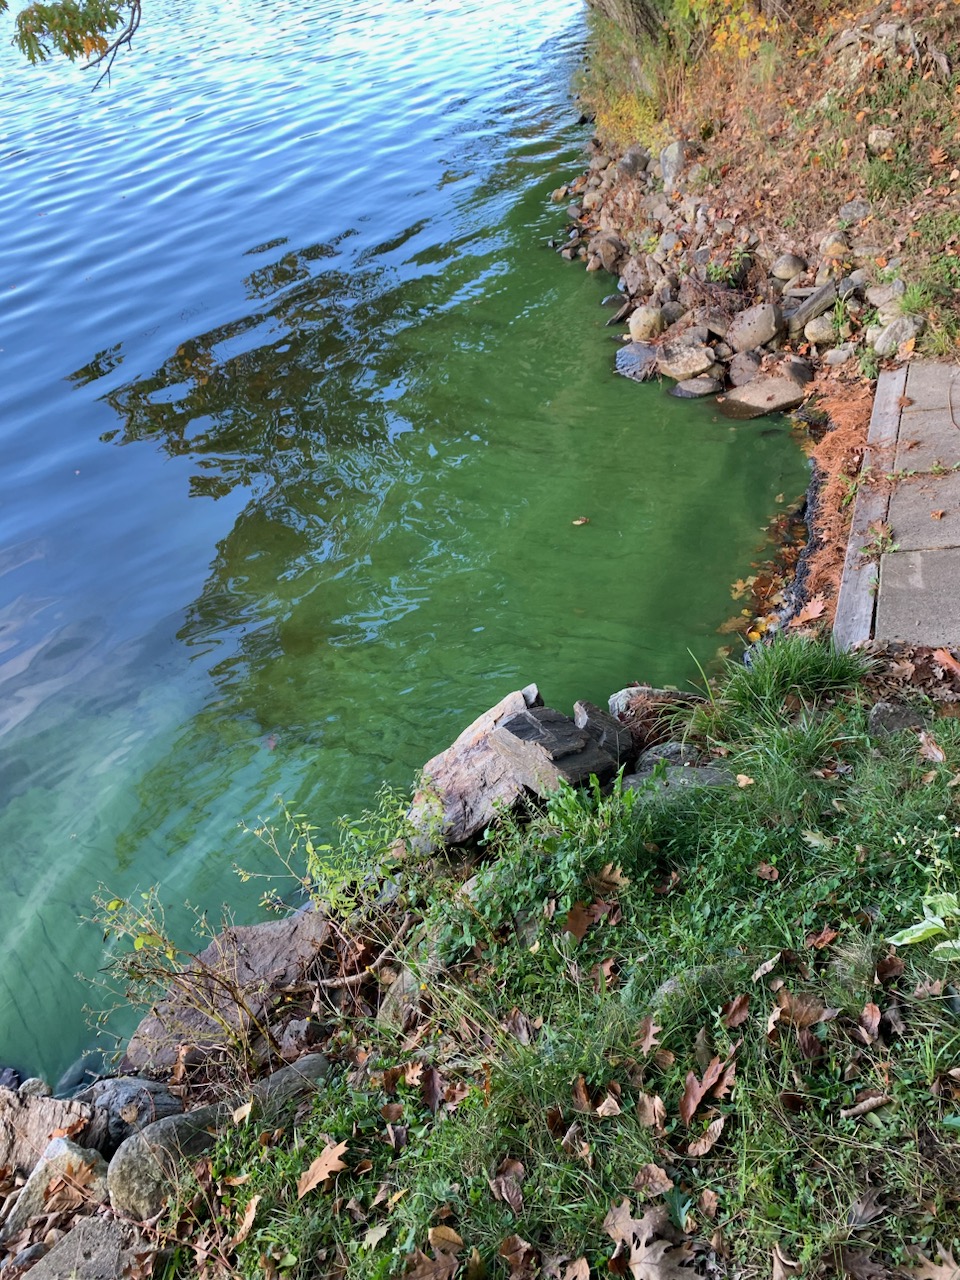
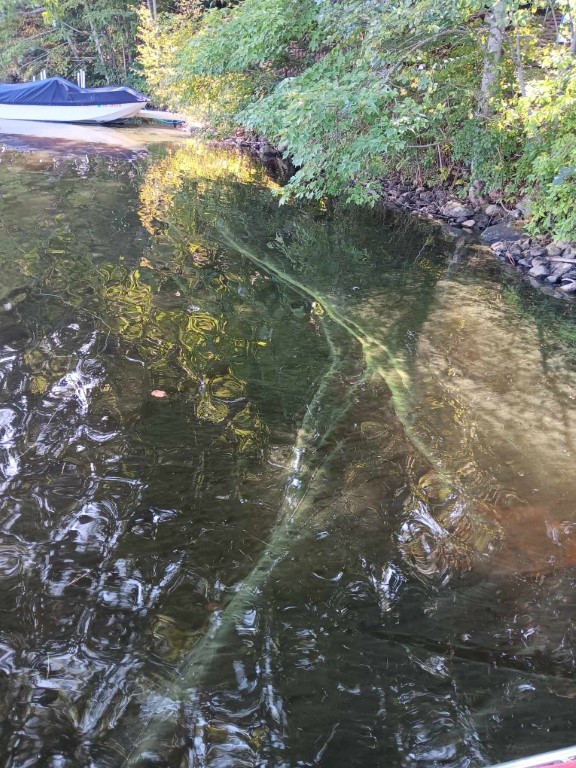
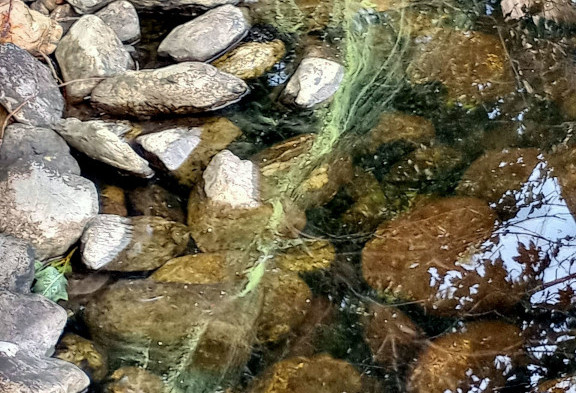
Transparency was the lowest we’ve seen it this year at only 2.70 meters (8.85 feet) with light obscuring particles of green algae quite evident in the water column. This was not surprising considering the fall turnover and the minor cyanobacteria bloom we’ve seen this fall. Compared to last year, what we’ve seen this fall is minor in deed.

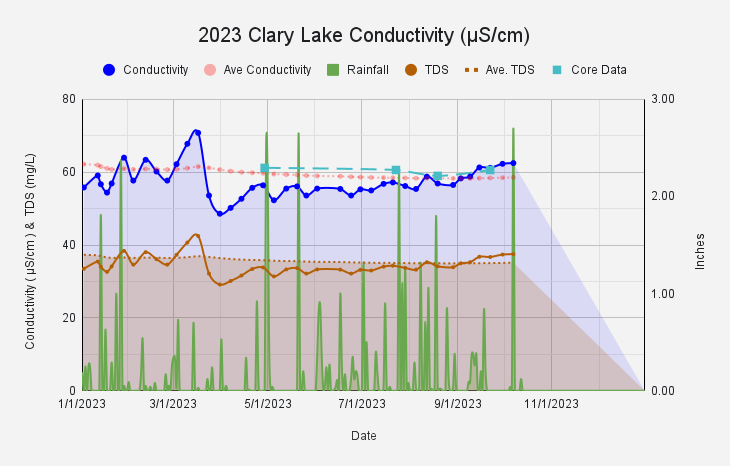
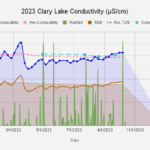
While we stop measuring transparency and dissolved oxygen in the fall and winter, I will continue to monitor lake conductivity (chart at left) throughout the year. Conductivity is a reasonable proxy for lake productivity and as winter sets in, I expect conductivity will drop. As you can see on the chart at left, conductivity of water collected at the outlet (the blue line) peaked in mid-March with snowmelt runoff which undoubtedly included road salt, then dropped way down with the influx of heavy rainfall around the 1st of May. Since then it’s been gradually climbing indicating increasing lake productivity. Unlike in MY case, productivity in a lake environment is a bad thing! Interestingly, conductivity of a core sample of lake water has remained relatively stable throughout the year. The implication of this is that runoff entering the lake (and there was a lot of runoff…) doesn’t mix much with the full volume of water in the lake. This is not surprising when you think about it: the temperature stratification of the lake so evident in the summer clearly isn’t disrupted by rainfall and runoff as anyone who has gone swimming this summer is well aware. Mixing only occurs in early fall when the surface temp starts to drop. This mixing is evident by the relatively sharp rise in conductivity starting in early September.

September 2023 Water Level Chart Archived

9 Clary-Lake-Water-Level-September-2023

September 2023

I have archived the September 2023 water level chart (above, and at left). The rain we’ve come to expect this Summer just didn’t materialize last month with only 2.80 inches of rain falling (73% of normal) or a full inch less than the 3.84 inches we would normally receive in September. An obvious impact has been the gradual drop in water level. That said, who didn’t like the extended stretch of warm dry weather in September? Of the first 9 months of 2023, only 3 months had less than the normal amount of precipitation: September (73% of normal), March (67% or normal) and February (52% of normal). The month with the highest precipitation was  July, with 8.2 inches (232% of normal) followed closely by January with 7.19 inches (225% of normal). Despite shortfalls in those three months, at the end of September we were still 12.65″ ahead of normal. To better grasp how big a differential that is consider that our average annual rainfall is 44.06 inches, and we’re already there- we’ve already received more than that. Even if we were to receive NO MORE rain or snow for the REST OF THE YEAR, we’d still end up a hair above normal annual rainfall. That is how far above normal precipitation we are this year. The overall precipitation statistics for 2023 are impressive. You’ll find all kinds of data and charts on the Precipitation sheet of our Clary Lake Dam Operation Log. Continue reading

Blue-Green Algae Finally Makes an Appearance

received_1018769282491571The lake has gone through its Fall Turnover meaning the temperature stratification that was a summertime feature of the lake has broken down and the lake water has mixed pretty much from top to bottom. The high winds from the remnants of Hurricane Lee last a week ago Saturday certainly helped with the mixing! Kelsie French and I were out doing our biweekly water quality monitoring last Friday and the water temperature at the surface (21.5°C) was only 2.5°C warmer than the water 8m (26ft) down. Two weeks ago the temperature difference from top to bottom was 7.8°C.

That turnover resulted in Phosphorus-rich water at the bottom of the lake mixing with the upper sunlit layers, giving a shot of nutrients to the cyanobacteria living there. A week later, they’re beginning to die off and float to the surface resulting in that telltale green scum on the water surface. The picture at left was sent to me by Jack Holland. Yesterday morning the green stuff was fairly evident over much of the lake surface (featured image, above), thanks to the lack of wind. It quickly dissipated when the wind picked up.

While no algae bloom is a good thing, as blooms go this one is pretty mild and it was expected.  Hopefully it won’t get much worse. Last fall you may recall we experienced a much worse bloom, way more intense and widespread that  went on for 3 months, extending all the way through November. It is likely all the rain we had this summer and the resulting flushing action that kept our water quality so high for so long.

August 2023 Water Level Chart Archived

8 Clary-Lake-Water-Level-August-2023

August 2023

I have archived the August 2023 water level chart (above, and at left). The rain we’ve come to expect this summer did not disappoint! We received a total of 6.79 inches in a month when normal is more like 3.33 inches. For the month of August we’re at 204% of normal; we recorded some amount of rain on 18 of the 31 days of the month. All this rain puts us at 41.44 inches for the year, fully 13.69 inches more than normal for this date. We normally receive around 44 inches of rain in a whole year. Quite impressive! Not surprisingly, the lake level bebopped along merrily in a narrow range between the top of the dam and the High Water Mark. The average water level for the month was -0.17 feet below the HWM; it briefly dropped below the top of the dam for 5 days and rose above the HWM for a couple. For most of the month we kept the gate open half a foot to keep the lake from rising too high. We’ve never had that concern in August! Continue reading

The Cyanobacteria in Clary Lake is Alive and Well

20230810_105153As nice as as our lake water has been this summer, and it has been nice, there is nonetheless cyanobacteria alive and well living in it. Runoff from all the rain we’ve received has washed sediment into the lake which is the primary source of phosphorus and phosphorus as you know by now is good for algae, bad for lakes. In the featured image above, taken by Jack Holland on the morning of August 10th, the telltale green scum comprised of dead blue-green algae is evident, but not terribly alarming compared to what we’ve seen before, even as recently as the first of June this year.  After Jack sent me his picture, I went down to my shoreline and took the picture at left. The telltale green sheen is so faint and ephemeral as to be easily overlooked. But it’s there. If this is as bad as it gets this year we’ll be very lucky. Continue reading

July 2023 Water Level Chart Archived

7 Clary-Lake-Water-Level-July-2023I have archived the July 2023 water level chart (above, and at left). The most notable thing about July was Holy Hannah did it rain! I thought we got a lot of rain in May with 5.40 inches and then we got even more rain in June, 5.51 inches in fact. I thought that was a lot of rain and then we got 8.2 inches of rain in July (normal is 3.54 inches).  For the year we’re 10+ inches ahead of normal rainfall for this date. Things are a little soggy, to say the least! One unsurprising effect of all this rain is that the lake level this summer, with minor exceptions, has remained at or above the top of the dam for several months- quite different from the past few summers. We started July with the lake level at  the top of the dam (-0.29′ below the HWM) and ended it even higher, almost 3 inches above the top of the dam (-0.05′ below the HWM). Continue reading

24 July 2023: Midsummer Water Quality Update

Clary Lake Transparency

Kelsie French and I got out on the lake on Sunday for our biweekly water quality data collection and the results are worth sharing. We had a secchi disk reading (a measure of lake transparency) of 4.18 meters (13.71 feet) which while not unheard of, is actually quite good, especially this time of year, considering all the rain we’ve received this summer. Rain means runoff and runoff means sediment and sediment means Phosphorus and Phosphorus means algae… Two weeks ago it was 3.80 meters (12.46 feet). I didn’t expect to see it improve, but it did! You can see today’s reading on the far right just above the 4 meter line on the above chart. We’re definitely trending in the right direction! You can see a subset of the data we collect back to 2012 on our Clary Lake Water Monitoring Data page.

On the downside, dissolved oxygen (DO) was only 1.1 mg/l at 4 meters which is damned low for such a shallow depth; 2 weeks ago it was 5.4 mg/l at 4 meters and 2.5 mg/l at 5 meters. Today it rapidly fell off from 4 meters and at 7 meters and below we found NO oxygen at all. Under these severely anaerobic conditions, Phosphorus which is normally stored in bottom sediments can reenter the water column. As long as it stays near the bottom, it’s not a problem but in the fall when the lake turns over, this Phosphorus rich water will mix with the upper layers where algae live, and this can spur out of control algae growth. This is why most severe algae blooms occur in the fall. The bloom we had last fall was in part due to this phenomena. There were other extenuating circumstances.

We also took the first of 3 core water samples we’ll take this season for Phosphorus testing. We’ll take another in mid-August and a 3rd in mid-September.

Right now, the water quality in Clary Lake is very good but that may change this fall. Time will tell.