
 I have archived the October 2023 water level chart (above, and at left). Rainfall for the month once again exceeded normal (a common refrain this year!) keeping the lake level higher than intended, at one point coming within almost an inch of the HWM with water flowing over the dam- unusual in October. By the end of the month however the lake was back down to 3/4 of a foot below the HWM which is about normal for this date. All told we received 5.36 inches of rain (normal is 4.45 inches) bringing us to 49.6 inches for the year, fully 13.6 inches above normal! Even if rainfall remains normal or below normal for the rest of the year, 2023 will still go down in the record book as an exceedingly wet year. We’ve seen greater-than-average rainfall in 7 of the first 10 months of 2023, and normally the wettest month of the year, November, is about to start.
 Sadly, Cyanobacteria continued to grow and prosper in Clary Lake this fall, fed primarily by Phosphorus brought to the surface with the the fall turnover. Consequently the sight of dead blue-green algae washing ashore while unpleasant, was not all that unexpected. The photograph at left taken by Danny Bell is dated 18 October 2023 and shows a particularly heavy concentration of dead algae along his shoreline. You’ll find other algae pictures in the Spring/Summer 2023 and the new Fall 2023 photo galleries.
I think one reason Clary’s water quality remained so high this past summer (along with a high water level) despite all the rain and sediment-laden runoff entering the lake was precisely because of all that rain, or more accurately, the flushing effect as a result of all that rain. For the most part, the runoff entering Clary Lake did not mix with all the water in the lake but remained at or near the surface, flowing towards the outlet, and finally leaving the lake. This means that much of the fine sediment and nutrients that entered with the runoff (what didn’t settle out) mostly left without fueling any significant algae growth. I’m basing this conclusion on temperature, conductivity, and transparency data we collected this year.
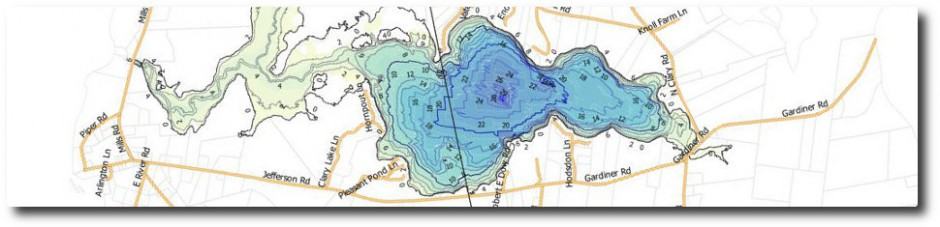
 Clary Lake when full contains 7,224 acre-feet of water (an acre-foot is 43560 cubic feet or one acre of water one foot deep). By early May, a full volume of lake water had already flowed downstream to the Sheepscot River. This in and of itself isn’t that unusual as most (but not all) years outflows reach 1 volume about this time. What’s different is that those high flows characteristic of late winter and early spring continued through the summer and by late October, a second full lake volume had flowed downstream as well. That’s 14,449 acre-feet of water, significantly more than has passed through the lake on this date in the previous 4 years, and the year isn’t over yet! The year with the next highest flows was 2019 (see chart at left) and we’re way ahead of that. Clary’s published flushing rate is 1.8x meaning that in a normal year the full volume of the lake “flushes” 1.8 times. That’s an average of course, based on the hydrologic characteristics of the watershed and historical rainfall amounts. Flushing rate and retention time (the inverse of flushing rate) are annual statistics so we’ll have to wait until the end of the year to see what they are, but we’re tracking these statistics on our Dam Operation Log and already it’s looking like this year they’re going to far exceed the average. Here’s a table showing flushing rates and retention times for the years 2019 through 2023:
Clary Lake Flushing Rate & Retention Time
| Year | Flushing Rate | Retention Time |
|---|---|---|
| 2019 | 2.14 | 168 Days |
| 2020 | 1.87 | 197 Days |
| 2021 | 1.42 | 257 Days |
| 2022 | 1.85 | 197 Days |
| 2023 | 2.67 | 134 Days |
Conclusion?
 It would be easy to conclude that lots of rain and a high flushing rate are good for Clary’s water quality, but I’m not prepared to do that. Traditionally, Clary’s water quality has been higher in drought years, presumably because of the lack of runoff, but then last year happened, we were in severe drought all summer and we ended up last fall with the worst algal bloom ever recorded. So clearly, there are many factors at play and how they interact any given year is still a bit of a mystery. We’ll keep collecting and analyzing data and maybe, one day, we’ll really understand how it all fits together 🙂
You’ll find all the charts in this post and more on the Current Water Level Charts page.