[November 2023] I’ve been working on this article about Total Phosphorus levels in Clary Lake for some time, another in our continuing education series, based on the premise that informed people make better Lake Stewards! The better we all understand lake science the better able we will be to protect and preserve our cherished natural resource. This article on Phosphorus in Clary Lake will be posted under Programs.
Total Phosphorus In Clary Lake
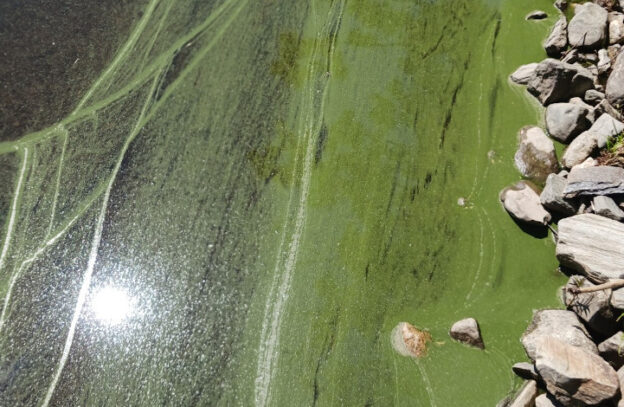
 Phosphorus (P) is an element on the Periodic chart and it exists in nature in rocks and soil in various forms. P is crucial to all life forms and in small amounts it is a good thing, but as you’ve all learned by now, too much P can cause excessive algae growth resulting in harmful algal blooms. Consequently, an important part of our Water Quality Monitoring program is collecting data on the Total Phosphorus (TP) load in Clary Lake, and studying how it varies over time (TP is a measure of ALL the phosphorus found in a sample whether it is dissolved or in particulate form). We take 3 water samples for TP testing every season, and our 3rd and final TP test result for 2023 is back so this seems like good time to dig into this important topic. On September 22nd we took a 7 meter core water sample; it came back showing 0.017 mg/L of TP. I was actually expecting a higher figure in the mid to upper 20s and I’m glad I was wrong, but clearly it was high enough to fuel a moderate month-long algal bloom this fall with sightings of dead green algae collecting along the shore as early as late September and as recently as the end of October. The blessing if there is one is that it didn’t happen during the summer! Last year we had generally higher TP readings and a much more severe algal bloom that started around September 1st and didn’t burn itself out until late November. Other factors do contribute to produce algal blooms, but the presence of Phosphorus (P) in our lake is the single biggest cause. When we say algal blooms, we’re mainly talking about excessive growth of blue-green algae, more commonly known as Cyanobacteria. We’ll cover Cyanobacteria in depth at another time.
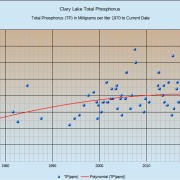
As you can see from the above chart, we’ve been measuring TP in Clary Lake since 1976. Starting in 1999 we increased the number of TP tests to 3 per year, sampled in July, August, and September corresponding to midsummer, late summer, and fall (the reasons for these choices will become clear below). The red trend line is a 2nd degree polynomial equation which rather optimistically suggests that P levels in Clary Lake are leveling off and even beginning to trend lower. A straight linear trend line suggests the exact opposite- that P levels are in fact rising. Perhaps reality is somewhere in between. In any case, as algal blooms in recent years suggest, P levels in Clary Lake are too high and we need to do something about it.
Algal blooms not only impact our water quality, they are a health risk to people, pets, and animals, they impact our use and enjoyment of the lake, and if you’re a lake shore owner, they adversely affect the value of your property. Nobody wants to buy property on a lake with green water! Therefore we consider monitoring P concentrations in our lake to be very important. Monitoring is the first step to actually doing anything about it, and understanding the P cycle in freshwater lakes is necessary if we’re going to make any progress in reducing the introduction of P into our lake. This article is primarily about HOW we monitor P in Clary Lake. The Clary Lake Association is also taking active measures to reduce the amount of P making its way into Clary lake with our new LakeSmart program and the recently announced 2024 Watershed Survey.
Trophic State
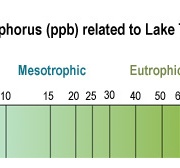
The Trophic State of a lake is a designation based on lake fertility i.e., the amount of nutrients (primarily P and Nitrogen) available to support biological activity. The chart at left (shows the correlation between TP (chart courtesy of RMBEL) measured in parts per billion) and Trophic State. At the far left of the scale are Oligotrophic lakes characterized by extremely clear, deep, cold water without a lot of P or other nutrients. These are your trout and salmon ponds for which Maine is so famous. At the other end of the scale are Eutrophic lakes which are characterized by high levels of nutrients including P, making them very fertile, with typically shallow, warm, murky water. In the middle are Mesotrophic lakes. Mesotrophic lakes undergo temperature stratification in the summertime with warm, oxygen rich water on top and cooler, oxygen deficient water at the bottom. The average TP value for Clary Lake is 0.019 mg/L (19 ppb) placing Clary squarely in the Mesotrophic part of the scale. One important aspect of Mesotrophic lakes is that while they may be partially spring fed, their water primarily comes from the watershed in the form of runoff from rainfall and snowmelt; this brings nutrients and sediment including P into the lake which supports biological activity and fuels algae growth. Oligotrophic lakes get some runoff of course, but they are primarily fed from springs and ground water which is largely nutrient free water. There is a similar scale that correlates lake transparency with trophic state and on that one Clary Lake is more toward the Eutrophic end of the scale, but this is due to our lake color which is brown from naturally occurring tannins, and also the chlorophyll content of our water is very high due to the presence of algae. I believe TP is the better trophic indicator for Clary Lake.
I’m not going to spend more time on Trophic state now, but it is worth further study: there are many aspects of Mesotrophic lakes we can learn about which can help us better understand Clary Lake. The Lakes of Maine site has loads of information specific to Clary Lake, and here’s a good site to learn more Lake Trophic States in general. A Google search will turn up many more.
Where Does Phosphorus Come From?
In the environment, P may be dissolved or in particulate form. Dissolved P (ortho-phosphate or soluble reactive phosphorus) is readily available to aquatic organisms, algae, and plants and is quickly taken up by them. Particulate P is usually associated with soil particles and is most readily accessible only to animals (dissolved phosphorus is typically identified as phosphorus particles small enough to pass through a 0.45 micron filter). Particulate P primarily moves around attached to soil particles in running water and easily makes its way into lakes where it can dissolve and become plant food. Some particulate P settles out and accumulates in lakebed sediment. It would be great if it stayed locked up in the mud, but it actually can be released back into the lake water through various biological and chemical mechanisms collectively known as “internal phosphorus loading” though it’s primarily understood to be a chemical process. Internal loading will be discussed below.
As you might have guessed from the above, the biggest source of P in lakes is from sediment washing into the lake with storm water runoff and snowmelt. The point source of erosion could be a washed out roadside ditch or culvert or a poorly maintained gravel road or driveway. Logging operations especially those involving stream crossings can result in significant soil erosion resulting in a great deal of sediment making its way into lakes. Erosion of shorelines due to wave action and ice damage can also be a significant source of sedimentation. Erosion of this type is referred to as nonpoint source pollution because it doesn’t come from a discrete point. P can also come from agricultural activity and in areas with a lot of farming, fertilizer can be a significant source of both P and N (nitrogen) as well as contributing to soil erosion and sedimentation. Natural weathering of soil and rocks can result in P entering lakes with runoff from rain storms. Septic systems, especially failing ones, can be a source of P. Laundry detergent often has a lot of P in it because it decreases the hardness of the water, allowing the detergent to clean better. In some localities, Orthophosphate is actually added to public drinking water systems to prevent the release of metals in drinking water! Fortunately, that is not a source of P we have to worry about.
Our TP Test Program
We take 3 water samples for TP testing every season. Here are the dates of the samples we took for this year, the core depth, and the TP results (you’ll find all our TP test data back to 2012 on our Clary Lake Water Monitoring Data page). Compared to historical TP levels in Clary Lake (see chart at top of page), this year’s test results were for the most part better than in recent years and mostly below our long term average:
| Date | Core Depth | TP |
| 07/23/2023 | 3 m (9.8 feet) | 0.022 mg/L |
| 08/19/2023 | 5 m (16.4 feet) | 0.014 mg/L |
| 09/22/2023 | 7 m (23 feet) | 0.017 mg/L |
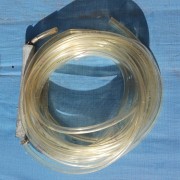 Water samples for TP testing are typically taken in one of two ways. The simplest method which does not need anything more than a sample bottle is called a “Surface grab.” A surface grab is just what it sounds like- you collect a sample of water at the surface by dipping your container into the lake, being careful to collect water that didn’t touch your hand. We use a more sophisticated method called a “Core sample” in which a column of water is collected in a length of clear vinyl tubing (picture at left), weighted at one end. The tube first thoroughly rinsed, then it is slowly lowered into the water to the desired depth, the upper end is pinched off, and the tube hauled up. The column of water is then dumped in a plastic jar. Three core samples are taken and mixed together. A sample for analysis is then measured out with a centrifuge tube which is then dumped into a sterilized plastic Erlenmeyer flask. Every effort is made at every step to prevent contamination of the water sample! The sample is refrigerated until it can be dropped off at the State’s Health and Environmental Testing Laboratory (HETL) in Augusta along with a chain of custody document. Currently a TP test costs $45 and takes about 5 weeks to get the results back. We have looked into doing our own TP analysis, but because the amount of P we’re concerned with (parts per billion) is incredibly small and hard to measure accurately, the analysis procedure is necessarily very sophisticated and does not lend itself to the casual home laboratory.
The depth at which a core water sample is taken is determined by examining the temperature and dissolved oxygen profile which we collect prior to doing the core sample. This allows us to determine the depths of the 3 primary layers of water in the lake.
Limnology 101
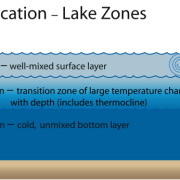 Mesotrophic lakes in temperate climes like Clary Lake undergo thermal stratification in the summertime which causes the water body to separate into 3 distinct layers (image at left). These layers are the Epilimnion, the Metalimnion, and the Hypolimnion. Our goal in collecting a core sample for TP testing is to collect a column of water from the Epilimnion only which is the upper layer of the lake. The epilimnion is generally well oxygenated and is subject to mixing through wave action. It is the most productive layer in the lake i.e., it contains the most biologic activity (phytoplankton, bacteria, algae, and fish).
The middle layer is called the Metalimnion (which in Clary is often little more than the thermocline) which separates the Epilimnion from the Hypolimnion or the bottom layer of the lake. Think of the Metalimnion as the transition zone between the oxygen rich surface waters and the anoxic (oxygen deficient) water of the bottom of the lake. It is characterized by a rather rapid drop in both temperature and dissolved oxygen, and in Clary Lake is often not much more than a meter or at the most two meters thick.
The bottom layer is the Hypolimnion. It extends from the bottom of the Metalimnion to the bottom of the lake. It’s dark down there, and the water is stagnant and cold. In mesotrophic lakes especially, due to their higher biological productivity, bacterial decomposition of organic matter consumes oxygen making the bottom water of mesotrophic lakes oxygen deficient (anoxic) often to the point of being almost without any dissolved oxygen at all. For this reason, mesotrophic lakes like Clary typically only support warm water fish species like Bass, White Perch, and Pickerel.
At the very bottom of the lake is a zone known as the Benthos, it consists of the bottom sediments (benthos) and the flora and fauna (benthic life) that live down there. It may be cold, dark, and anoxic down there but it is still a biologically and chemically active zone. Phosphorus is stored in the bottom sediments of lakes and as long as it stays there, all is well. However, and especially under conditions of low to no oxygen, a process known as “internal phosphorus loading” can occur which results in phosphorus reentering the lake water. As I mentioned, internal phosphorus loading is most commonly understood to be a chemical process but there are also physical and biological processes which mobilize P from bottom sediments and back into the water column. I’m not going to delve deeply into the processes involved in internal loading (you’re welcome!). A scholarly article “Internal phosphorus loading in Canadian fresh waters: a critical review and data analysis from the Canadian Journal of Fisheries and Aquatic Sciences goes into exquisite detail on the subject for which reference may be had for full discussion on the subject. A Google search will turn up others.
Midsummer Water Monitoring
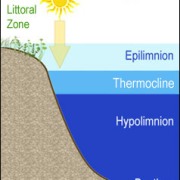 The image at left (courtesy of of RMBEL) nicely shows Clary Lake in midsummer. A look at our data sheet (below) from our water quality monitoring session on July 23, 2023, the day we took our first TP water sample of the season shows the stratification clearly. You can see that at 4 meters, the temperature and dissolved oxygen (DO) had dropped from 26.3° C and 9.1 mg/L at the surface to 24.5° C and 8.6 mg/L at 3 meters and then quickly to 20.1° C and 1.1 mg/L at 4 meters- a drop in 1 meter of 4.4° C and 7.5 mg/L in DO. We concluded from this that the epilimnion consisted of the top 3 meters of the lake and so took our core water samples at that depth. You can see that below 4 meters the temperature continued to drop and DO rapidly
  dropped to almost none at 5 meters and literally none at 7 meters and below- a situation that results in internal phosphorus loading. Also shown on this data sheet are our Secchi disk readings- Kelsie French with her younger eyes recorded 4.18 meters and I with my 70 year old eyes recorded 4.00 meters. That’s pretty good for Clary Lake in mid-summer Periodically we mail the hard copies of these data sheets into Lake Stewards of Maine where they are checked and then forwarded on to DEP. Information through 2018 has been made available on the Lakes of Maine website.
Fall Turnover
 If all this P from internal loading stayed at the bottom of the lake, it wouldn’t be a problem. There’s no light to speak of down there and hence not a lot of biological activity. Algae live in the epilimnion, not the hypolimnion. However, in the fall when the surface water starts to cool off, the stratification in the lake begins to break down and a process known as fall turnover takes place (image at left, courtesy of RMBEL). The hypolimnion mixes with the epilimnion, and the lake becomes homogenous in both temperature and dissolved oxygen. The data sheet from our final water quality monitoring session this year, at left, shows this situation clearly! The temperature and DO at the surface is 16.7° C and 8.5 mg/L; 8 meters down the temperature
  and DO, at 16.5° C and 8.4 mg/L, are almost unchanged. At this point the lake has mixed and is no longer stratified. Lake transparency has also dropped off significantly to 2.70 meters (8.8 feet) due to the presence of blue-green algae in the water column. By early September the lake turnover was well underway mixing P-rich water from the bottom of the lake with the upper sunlit layers, where the algae and cyanobacteria are living. This is why we see most (but not all) algal blooms in the fall.
Winter Stasis
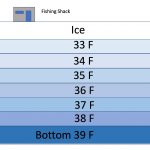 To complete the cycle, in winter, mesotrophic lakes again thermally stratify and go mostly dormant while ice covered, but winter stratification is not at all like summer stratification when you have warm water on top of a thermocline and cold water underneath that down to the bottom (diagram at left). In winter, the lake is ice covered and the coldest water collects right under the ice, floating above the somewhat warmer and denser hypolimnion with the warmest water at the bottom of the lake! This is due of the peculiar characteristic of water becoming less dense once its temperature drops below 39° C, reaching a minimum density when it reaches 0° C (32° F) and freezes. This is why ice floats (see the article “Ice Berms & Pressure Ridges” for a full explanation of this fascinating phenomena). In the Spring, with warming weather, lake turnover happens again and the process of summer temperature stratification starts all over again.
In Summary
In summary, mesotrophic lakes like Clary go through a temperature driven annual cycle of Spring Turnover, Summer Stratification, Fall Turnover, and Winter Stratification. Summer Stratification leads to anoxic (oxygen deficient) conditions in the hypolimnion due to bacterial decomposition of organic matter, and those anoxic conditions result internal loading of P from the bottom sediments. What this means is that we have a Phosphorus problem in Clary Lake even without the introduction of additional P from non-point source pollution! This makes it that much more important that we work to identify and eliminate areas of non-point source pollution in the Clary Lake watershed. With your help, by supporting the Clary Lake Association and by participating in our new LakeSmart program and helping with our upcoming 2024 Watershed Survey, we can do this! For more information about how you can help, please contact George Fergusson or use our Contact Form to reach out.
Published 19 November 2023

