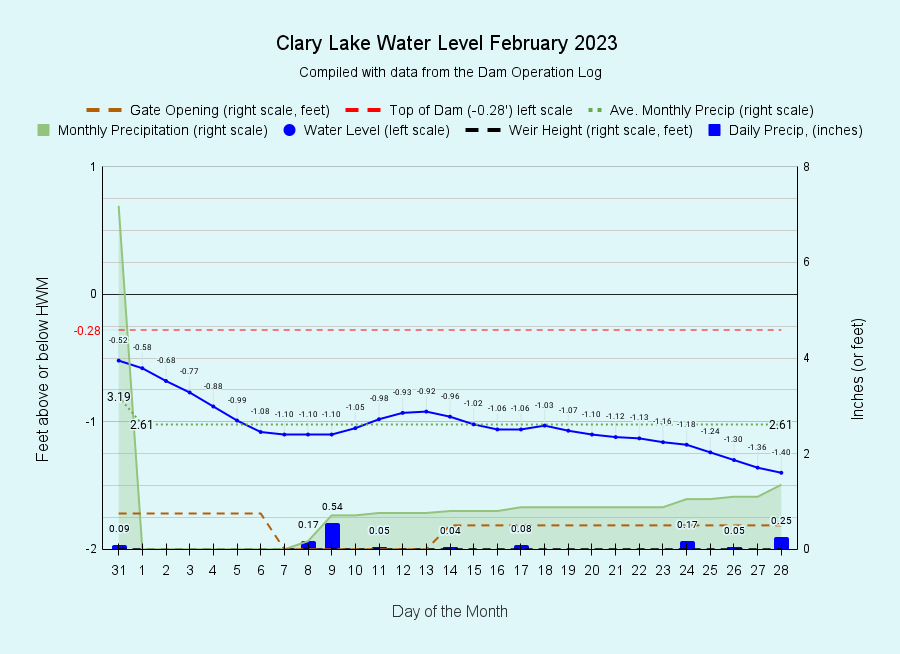
I have archived the February 2023 water level chart (at left). February did not continue the wet trend that start the new year. On the contrary. February has the smallest average monthly precipitation of only 2.61 inches but we failed to reach even that low bar, receiving only 1.35 of precipitation for the month, mostly in the form of snow. We started February fully 4 inches ahead of average precipitation, but we lost ground, ending the month only 2.74 inches above average. Despite this, because we received so much precipitation in January, outflows from Clary Lake remained extremely high for the entire month. How high you ask? In the first two months of 2022, total outflows from Clary Lake amounted to 2231 acre-feet of water. In the first two months of 2023, outflows amounted to 4667 acre-feet or more than TWICE as much water. In other words, in the first two months of 2023 more than half the full volume of the lake passed through Clary Lake. In fact, outflows in the first 2 months of 2023 far exceed outflows during the same two-month period for the last 5 years, back to 2019 with the greatest disparity occurring in 2021:
Total Outflows For the First Two Months, 2019 to Present
| Year | Outflows in acre-feet in first 2 months | Flows as a Percentage of 2023 flows | Flows as a Percentage of Lake Volume |
|---|---|---|---|
| 2023 | 4667 | 100% | 65% |
| 2022 | 2231 | 48% | 31% |
| 2021 | 1873 | 40% | 26% |
| 2020 | 2445 | 52% | 34% |
| 2019 | 2713 | 58% | 38% |
It remains to be seen just what effect the high outflows we’ve seen this winter will have on Clary Lake’s water quality and ecology later this year.
Large outflows result from large inflows (duh), some of which runs off in streams and over the ground into the lake, and some of which actually seeps out of the ground into the lake. To keep the lake level down where it belongs this time of year rather than overtopping the dam, we had weir wide open and the gate partially open for most of the month. As a result, the lake level started at a high of -0.52 feet on February 1st, rose slightly around the middle of the month, to end -1.40 feet down on the 28th- right about where we want it. The gate was only fully closed for 6 days, from the 7th to the 13th. We’re now getting ready to start raising the lake level to it’s spring time high. Spring IS coming!


I wonder if it will flush out some of that bad algae growing stuuff.
Ah, you mean Phosphorus? Hard to say. I’d like to think a high flushing rate this time of year is a good thing, but actually, lakes with generally high flushing rates tend to have higher concentrations of Phosphorus and lower water quality because high flushing rates correspond to high runoff rates and that’s where a lot of the Phosphorus comes from. In the past, drought conditions (low flushing rates) in summer have tended to favor good water quality in Clary Lake. Except for last year, where we were in drought all summer and evaporation took a foot of water out of the lake, concentrating nutrients and leading to the worst algae bloom anyone can remember.
There are a lot of factors at play, and how they interact makes a big difference. Fascinating.