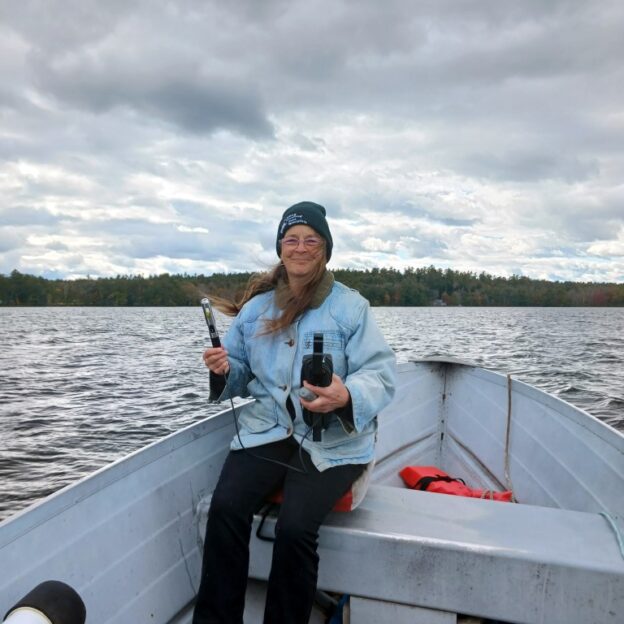
 On Friday afternoon, October 13th, Kelsie French and I wrapped up another season of water quality monitoring on Clary Lake. Started by my father Stuart Fergusson and David Hodsdon back in 1975, this marks the 48th year quality data data has been collected Clary Lake one of the longest monitored lakes in Maine. It’s not summer anymore and the last day on the lake is typically cold, raw, and windy. This one was no exception as the above picture of Kelsie French (getting an air temperature reading) suggests! The weather wasn’t near as bad as we’ve experienced before, not by a long shot. We do prefer days more like the picture at left, taken back in August.
We were a little late getting started this spring thanks to a bad cable on our YSI Pro 20 Dissolved Oxygen meter which we purchased new in 2013. The new cable cost $390 and didn’t arrive until early June. Consequently, our first data collection session on the lake wasn’t until June 11th. We usually like to start in late April or early May.
It isn’t simply cold weather that brings our water quality monitoring season to a close, it’s the fact the lake has “turned over” meaning the lake water is now thoroughly mixed from top to bottom. The lake basically goes into “rest” mode for the winter and most biologic activity winds down and becomes dormant for the winter. Soon the lake will freeze over (to learn more about that process, see this page on Ice Berms & Pressure Ridges). During Friday’s data collection session we observed surface dissolved oxygen and temperature readings of 8.5 mg/liter and 16.7°C (62°F) and near the bottom at 8 meters it was little different (8.4 mg/liter of dissolved oxygen and a temperature of 16.5° C). Once turnover happens in the fall, there is little reason to continue with water quality monitoring. The season is over. We’re still waiting on the results of our last Total Phosphorus test sample taken on September 22nd. I’ll post them on the Clary Lake Water Quality Monitoring data page when it arrives; I expect it will be higher than normal due to the fall turnover.
 Transparency was the lowest we’ve seen it this year at only 2.70 meters (8.85 feet) with light obscuring particles of green algae quite evident in the water column. This was not surprising considering the fall turnover and the minor cyanobacteria bloom we’ve seen this fall. Compared to last year, what we’ve seen this fall is minor in deed.
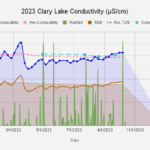
 While we stop measuring transparency and dissolved oxygen in the fall and winter, I will continue to monitor lake conductivity (chart at left) throughout the year. Conductivity is a reasonable proxy for lake productivity and as winter sets in, I expect conductivity will drop. As you can see on the chart at left, conductivity of water collected at the outlet (the blue line) peaked in mid-March with snowmelt runoff which undoubtedly included road salt, then dropped way down with the influx of heavy rainfall around the 1st of May. Since then it’s been gradually climbing indicating increasing lake productivity. Unlike in MY case, productivity in a lake environment is a bad thing! Interestingly, conductivity of a core sample of lake water has remained relatively stable throughout the year. The implication of this is that runoff entering the lake (and there was a lot of runoff…) doesn’t mix much with the full volume of water in the lake. This is not surprising when you think about it: the temperature stratification of the lake so evident in the summer clearly isn’t disrupted by rainfall and runoff as anyone who has gone swimming this summer is well aware. Mixing only occurs in early fall when the surface temp starts to drop. This mixing is evident by the relatively sharp rise in conductivity starting in early September.

