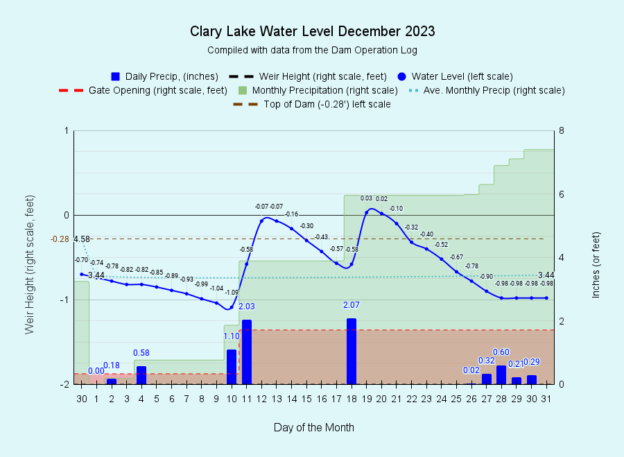
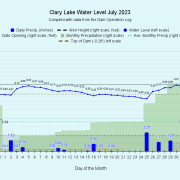
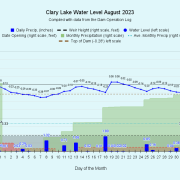
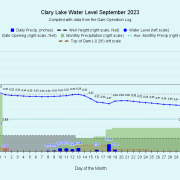
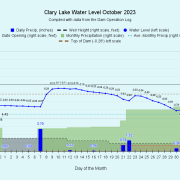
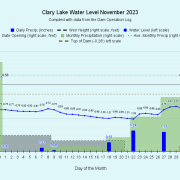
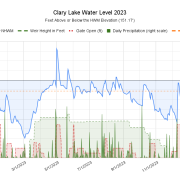
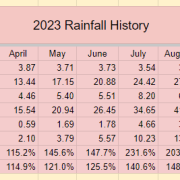
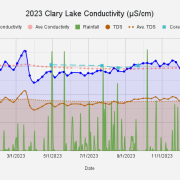
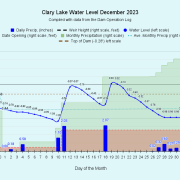
 And that’s a wrap! I have archived the December water level chart (at left and above) bringing 2023 to a close. Once again as has happened so often this past year, December rainfall vastly exceeded the monthly average. We received 7.47 inches of rain in December, 4.03 inches more than the average of 3.44 inches. We ended the year with a total of 60.31 inches of precipitation, 16.25 inches more than the annual average of 44.06 inches. To say it was a wet year doesn’t quite do it justice: we got soaked in 2023! All this rain resulted in some wild swings in the lake level in December with it twice rising above the High Water Mark resulting in gentle overtopping of the dam. This isn’t actually all that unusual. Despite our efforts to keep the lake level “down where it belongs” going into Winter, over-topping in December happens roughly 3 years out of 5.
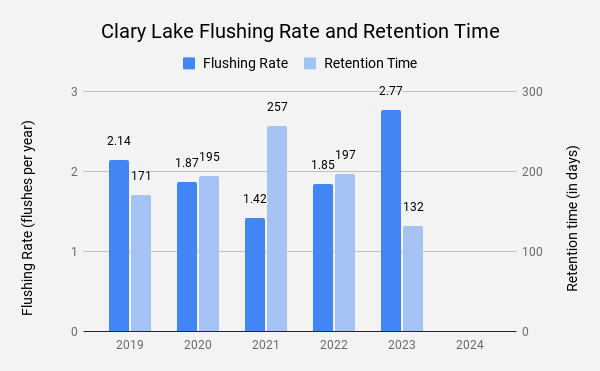
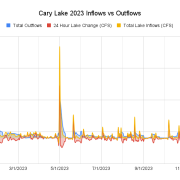
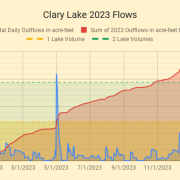
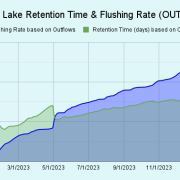
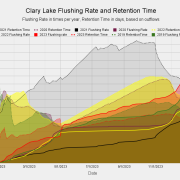
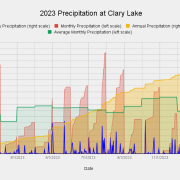 The real story of 2023 was all the rain we received and the incredible volume of water that passed through Clary Lake as a result of it. Rainfall significantly exceeded monthly averages for 8 of the 12 months in 2023 (see chart at left) resulting in a good third more water than normal passing through Clary (what’s normal?). In numbers, over 20,000 acre-feet of water flowed through the lake and downstream to the Sheepscot River, or almost 3 full lake volumes (an acre-foot of water is one acre of water 1 foot deep, or 43,560 cubic feet). The 2023 flushing rate (the number of times a lake fully exchanges it’s volume in one year) is 2.8X, the highest we’ve measured since starting record keeping in in 2019. The inverse of Flushing Rate is Retention Time (or residence time) which is the mean time in days that water spends in the lake before reaching the dam and leaving the lake. Retention time in 2023 was a relatively short 134 days. Here’s a table of Flushing Rate and Retention Time for the past five years:
Flows and Water Quality
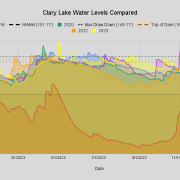
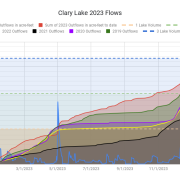 Both Flushing Rate and Retention Time are annual statistics but that doesn’t mean we can’t learn something by keeping an eye on the accumulation of flows as they occur during the course of the year, especially when compared to flows from previous years. By looking at data from previous years we can begin to see how flows affect water quality. The chart on the Statistics sheet (at left) of the Clary Dam Operation Log does just that. The jury is still out on whether high-flows are universally better than low-flows for water quality because flow is only one variable among many, but there is evidence to suggest that higher flows tend to correlate with better water quality. In 2023 with all the rainfall and resulting runoff, transport of sediment into the lake could well have resulted in severely reduced water quality but our water quality held up rather well throughout the summer. Looking back to 2022 when we were in serious drought for the entire summer and flows were almost non-existent, water quality declined significantly and we ended up with the worst fall algae bloom on record.
There’s a lot more I could talk about but it’s New Year’s Eve and I’m going to put this post to bed. Tomorrow is another day and another year. I’ve added the 2023 Charts to the archive. Here’s a convenient gallery to check them out. Happy New Year everyone 🙂

