Category Archives: Technical Lake Stuff

June 2023 Water Level Chart Archived

6 Clary-Lake-Water-Level-June-2023

June 2023

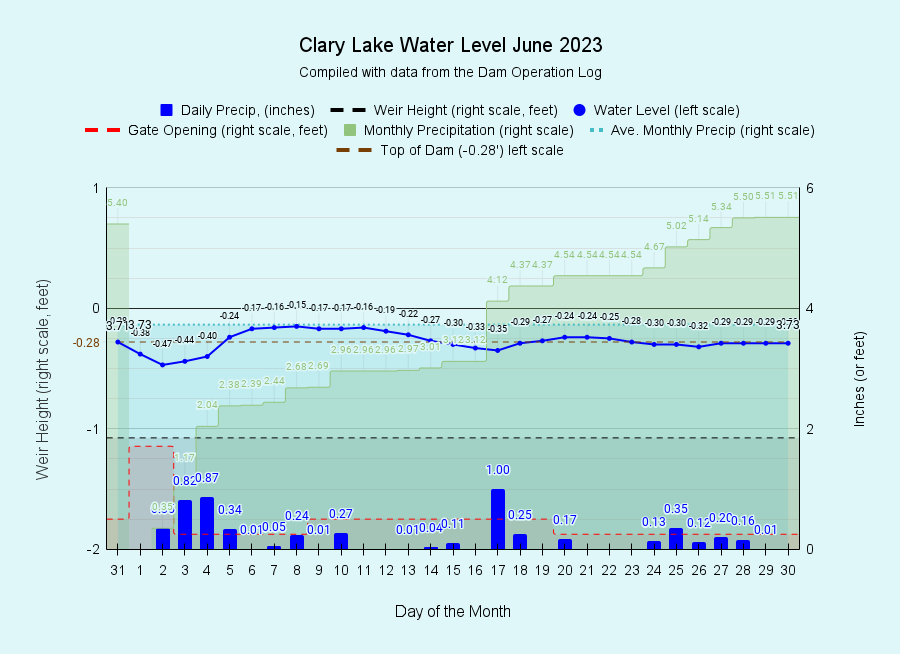
I have archived the June 2023 water level chart (at left). If there is one thing that stands out about June 2023 is it was a wet month! We received some amount of rain on 21 of the 30 days of the month making this June the wettest June since 2019.

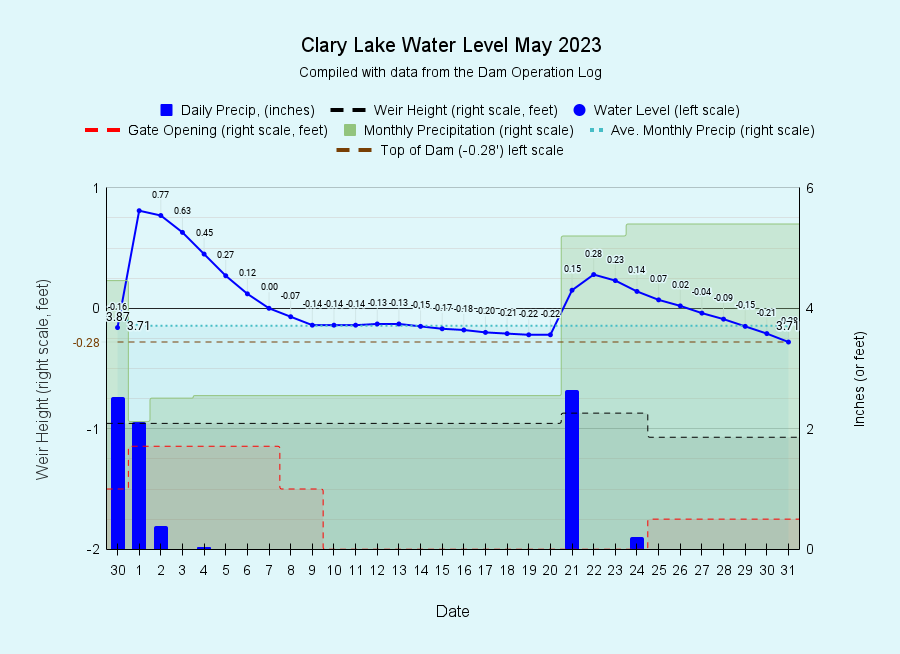
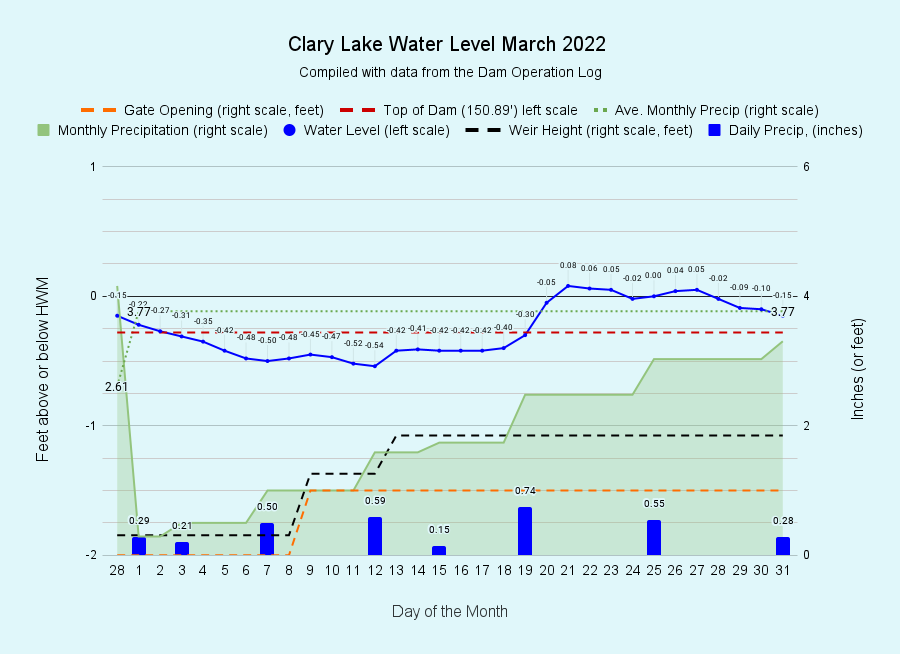
All told we received a total of 5.51 inches of rain in June, 1.77 inches more than the 3.73 inches which is normal for June. Despite February and March being well below average precipitation, at the end of June we’re fully 5.51 inches of rainfall ABOVE NORMAL for this date. Yes it’s been wet this year! Unlike April and May which both had rather large rain events, most of the rain events in June were small, averaging only 0.28″ per event. It’s like we were dribbled on for the whole month. Despite the almost constant rain, the lake level 
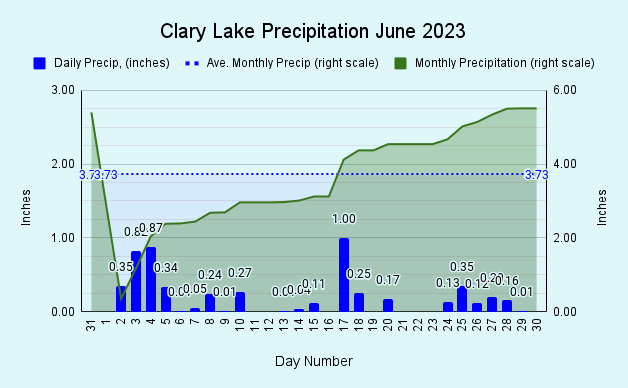
remained remarkably stable. With only slight adjustments of the outflows we were able to maintain the lake within a very narrow 3.8 inch range for the whole month, more or less centered around the top of the dam. We started the month at -0.28 feet (top of the dam) and ended the month at the same level. You’ll find ALL the relevant charts (water level, rainfall, flows, etc.) on our Current Clary Lake Water Level Charts page.

20230601_103557
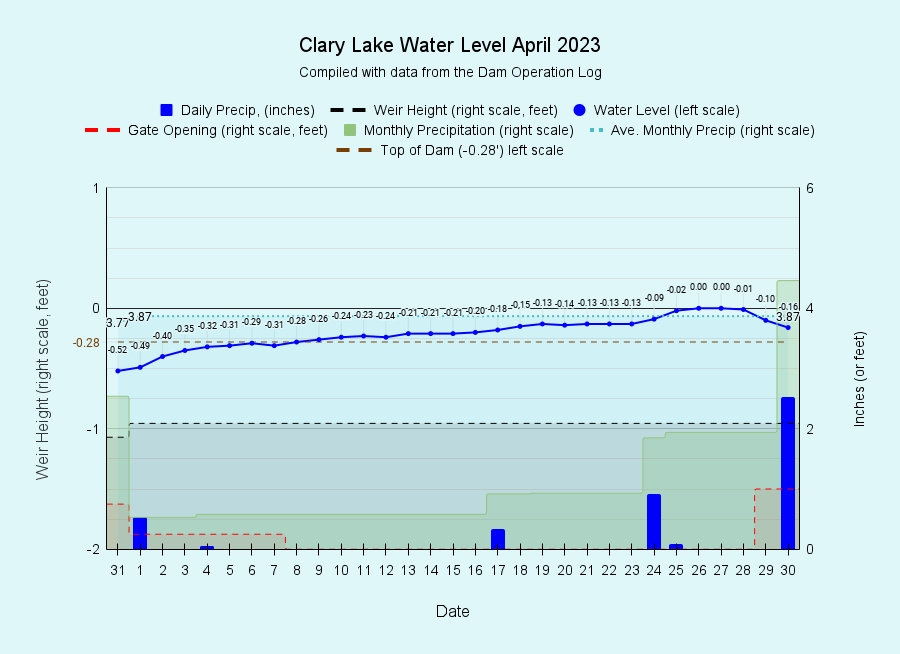
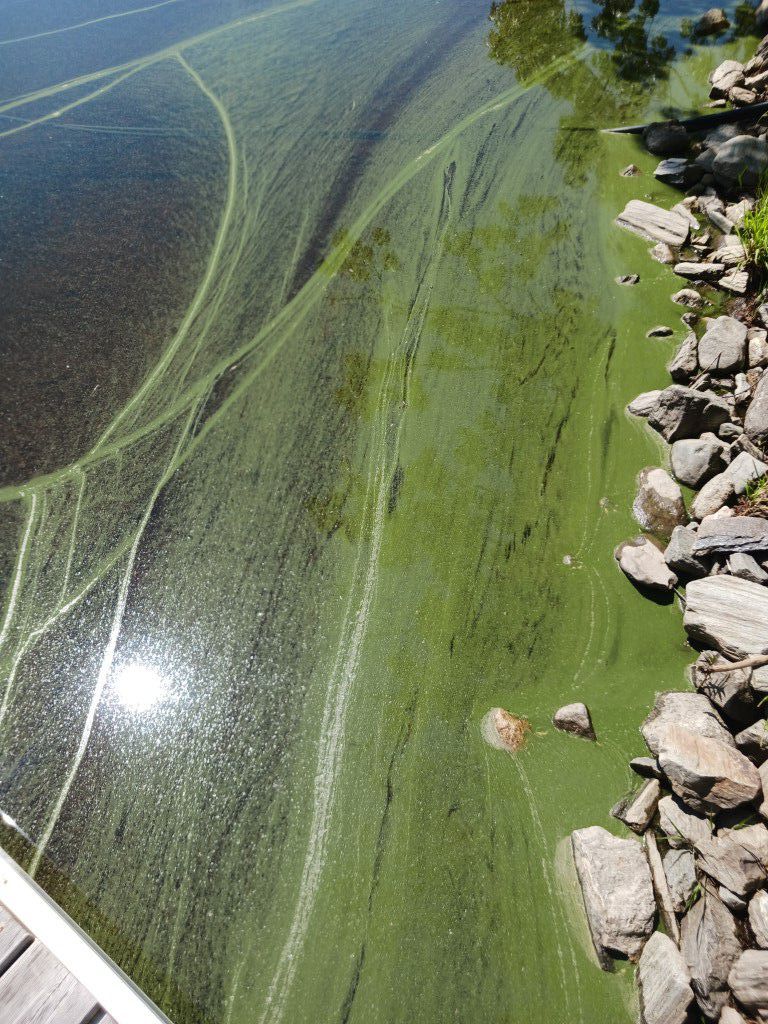
June started out with a short but intense die off of blue-green algae (picture at left), the growth of which was fed primarily by sediment-born Phosphorus introduced into the lake during the intense two-day rain event that took place on April 30th and May 1st. We received a total of 5 inches of rain in those 2 days resulting in the highest lake level we’ve ever recorded, and washed out driveways and roads all over the State. Untold tons of sediment washed into Clary Lake as a result of that one storm. One month later around the first of June, the cyanobacteria that had multiplied with the influx of food started to die and float to the surface where it was corralled by wind and currents along the south and west shore of Clary Lake. It is likely people on the northeast and east shore of the lake never noticed a thing. I collected a sample and dropped it off at the lab at DEP in Augusta. The sample was predominated by Dolichospermum flos-aquae, formerly Anabaena flos-aquae, a blue-green or cyanobacteria species. There was a lot of pine pollen in the sample as well. As the month progressed, the water column cleared considerably with secchi disk reading of 3.87 meters (12.7 feet) on June 23rd.

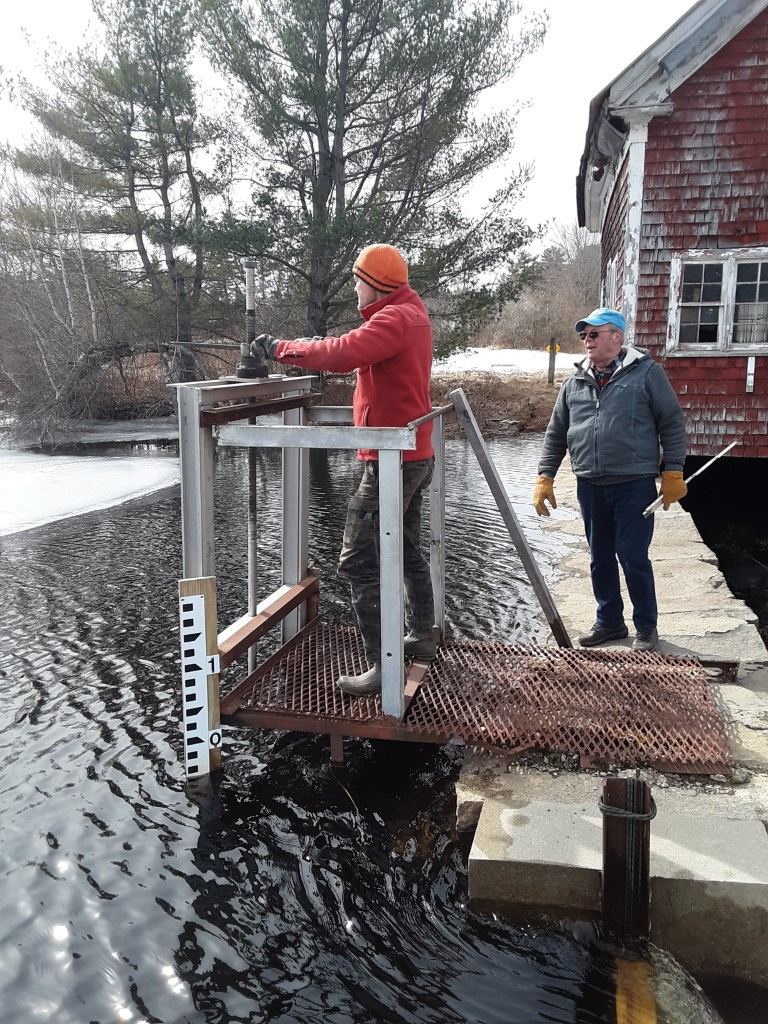
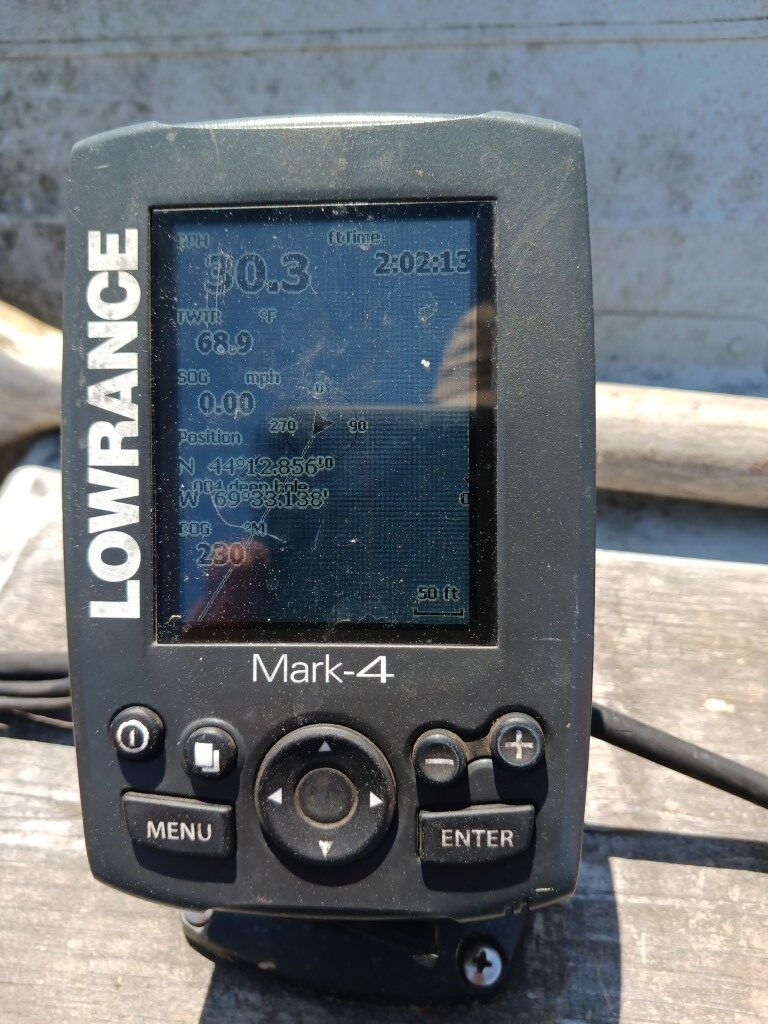
Kelsie French and I got an early start to our 2023 water quality monitoring season in late April with a trip out to the deep hole (picture at left) but the next time out erratic behavior with our YSI Pro 20 Dissolved Oxygen meter prevented data collection. It took some time, but by process of elimination we were finally able to determine that the cable on our 14 year old meter had failed. We ordered a new one for $380 + $10 shipping. They said it would be 7 weeks for delivery but it arrived after only 5 weeks. The new cable solved our problem and we were able resume data collection on June 11th. We’ll be out there every 2 weeks until mid-October. If you see us out there on a Friday afternoon in my red boat, anchored in the middle of the lake, stop by and say hello!

May 2023 Water Level Chart Archived

5 Clary-Lake-Water-Level-May-2023

May 2023

I have archived the March 2023 water level chart (at left).  We experienced two large rain events during the month with the result that there was water flowing over the top of the dam for the entire month. The first storm which started on April 30th and ended 3 days later kind of caught us by surprise. It went stationary, ultimately dumping 5 inches of rain on us and raising the lake level to +0.77 above the high water mark, the highest water level we’ve recorded since we purchased the dam back in the fall of 2018. The previous high was +0.58 feet back in April 2020. We thought that was pretty high! At its peak height on May 1st there was over a foot of water flowing over the dam. Then on the 22nd we received 2.65 inches of rain which raised the lake level to +0.28 feet above the high water mark. All told we received 5.40 inches of rain in May, 1.7 inches more than normal. Despite below average precipitation in February and March, for the year we’re 3.79 inches ahead of normal on this date.  Continue reading

April 2023 Water Level Chart Archived

Clary-Lake-Water-Level-April-2023

April 2023

I have archived the March 2023 water level chart (at left). It looked like the dearth of precipitation that’s characterized February and March was going to continue through April, until the last day of the month when we received a whopping 2.52 inches of rain. The storm has continued into today, the first day of May with an additional 1.98 inches bringing the storm total to 4.64 inches! As of the end of April, accumulated precipitation for the year was 15.54 inches (it’s more than that today), fully 2.1 inches above normal for this date. At the time of this writing, this impressive overnight rainfall has raised the lake level to +0.85 (152.02 feet) which is the highest level we’ve recorded since we purchased the dam in the Fall of 2018. Peak runoff typically occurs 24 hours after the rain event, so I have not doubt that the lake level will rise higher. You’ll want to keep your eye on the Current Water Level Chart.

20230501_063348Here’s a picture I took this morning (at left) when the flows over the dam were around 268 cfs (cubic feet per second). Since then the lake has come up another 3 inches. I checked the level just before dark and it was up to +0.89 feet. The previous record water level  since we purchased the dam in October 2018 was achieved on April 14, 2020 topped and out at +0.58 feet above the HWM. We’re over 3 inches above that already! Chester Chase owned the dam for nearly 50 years and his son Tim assures me that he’s seen it this high and higher during the years he spent growing up in Whitefield. Albert Boynton, who was born in the red house on the dam and whose family owned the dam back in the 1920s and early 1930s once told me that he remembers seeing the lake so high it was running over the road. That’s high!

The flow numbers for the April 30 storm are impressive! You can see that the daily outflows in acre-feet (43,560 cubic feet) of water so far this year  (the blue line in the chart at left) have been pretty sedate so far this year until yesterday when they went through the roof with 605 acre-feet. Thanks to the storm, a wee bit more than 1 full lake volume of water (7,224 acre-feet) has flowed downstream so far this year. A lot of sediment washed into the lake during this storm, which is generally a bad thing. On the other hand, a lot of that water flowed right out again. It remains to be seen how this will impact our lake water quality this year.

I can write all day long about how high the water was, but there’s nothing quite like a video to convey an impression. I’ve already posted a video I took over at the dam yesterday morning. Here it is again:

7 April 2023: Spring Turnover and More!

I stopped at the boat launch the other day to check out the waves, and I was not disappointed! It’s windy days like this in the early Spring that churn up the lake water, mixing it together from top to bottom in a process known as Spring Turnover. The water column ends up with a uniform (and cold) temperature and the oxygen profile is similarly homogenous. Then throughout the course of the summer, the lake water stratifies with the surface warming up while remaining cold down below the thermocline. Then same turnover thing happens in the Fall, mixing the water once again. It’s an endless cycle: Spring turnover, Summer Stratification, and Fall turnover. 

This video not only shows this turnover process taking place, you can also see the lines of white froth resulting from Langmuir Rotation.

March 2023 Water Level Chart Archived

3 Clary-Lake-Water-Level-March-2023

March 2023

I have archived the March 2023 water level chart (at left). The precipitation deficit we saw in February continued into March with only about 2.5 inches of precipitation falling, well below the average for March of 3.77 inches. However, due to the excess precipitation we received in January, we’re still 1.5 inches ahead of normal for this date. March is when we start the process of gradually raising the lake level by adding stop logs to the weir, while at the same time trying to maintain minimum flows to sustain the downstream aquatic habitat. We could really use some extra water in March to help with this process, but it didn’t happen this year. Given the conflicting mandates in the Water Level Order i.e., raising the lake level to it’s full capacity by ice out AND maintaining minimum flows at the same time, it’s a rare year when we can accomplish both! Usually something has to give and raising the lake level to where it belongs in the spring is our number one priority. We did succeed in gradually raising the lake level about a foot over the course of the month to within 1/2 a foot of the HWM, by the end of the month. With close to a half inch of rain falling on this first day of April, we should be overtopping the dam shortly. No fooling! Continue reading

February 2023 Water Level Chart Archived

2 Clary-Lake-Water-Level-February-2023

February 2023

I have archived the February 2023 water level chart (at left). February did not continue the wet trend that start the new year. On the contrary. February has the smallest average monthly precipitation of only 2.61 inches but we failed to reach even that low bar, receiving only 1.35 of precipitation for the month, mostly in the form of snow. We started February fully 4 inches ahead of average precipitation, but we lost ground, ending the month only 2.74 inches above average. Despite this, because we received so much precipitation in January, outflows from Clary Lake remained extremely high for the entire month. How high you ask? In the first two months of 2022, total outflows from Clary Lake amounted to 2231 acre-feet of water. In the first two months of 2023, outflows amounted to 4667 acre-feet or more than TWICE as much water. In other words, in the first two months of 2023 more than half the full volume of the lake passed through Clary Lake. In fact, outflows in the first 2 months of 2023 far exceed outflows during the same two-month period for the last 5 years, back to 2019 with the greatest disparity occurring in 2021: Continue reading

January 2023 Water Level Chart Archived

1 Clary-Lake-Water-Level-January-2023

January 2023

I have archived the January 2023 water level chart (at left). By far the most impressive thing about January was how much snow and rain we got! Total precipitation including rain and (melted) snow was 7.19 inches of water which is more than twice the average  precipitation for January of 3.19 inches. We’re starting off the year fully 4 inches above normal for this date. This will benefit ground water supplies this coming year. Even with all the snow and rainfall however, the water level was relatively stable though it was a little higher than we like to maintain it this time of year, due to all the inflows. January and February are usually pretty sedate months from a water level management perspective but this year we’ve had to open the gate a couple of times to let out more water just to keep the lake from overtopping the dam. There’s nothing wrong with overtopping, but this time of year it leads to ice formation which makes walking on the dam treacherous. We also like to keep the lake level lower in the winter to prevent ice damage to the shoreline. Mother nature however usually has her way. Continue reading

December 2022 Water Level Chart Archived

12 Clary-Lake-Water-Level-December-2022

December 2022

And that’s a wrap! I have archived the December water level chart (at left) bringing 2022 to a close. I guess the most impressive thing about December had to be the huge 24 hour lake level rise of 15.8″ from just 3″ of rain (and a little snow melt) on the day before Christmas for a runoff multiplier of over 5X. You can see excessive runoff this time of year because frozen ground means more rain runs off and less soaks into the ground. We’ve seen some big lake level responses to rainfall, but this is one of the biggest I can remember in a long time. Continue reading

14 December 2022: Clary Lake ALMOST but NOT QUITE Iced Over

Almost-ice-in-campicYesterday afternoon Clary appeared to be fully ice covered and I was about to call it, but the bit of snow we received in the night has revealed some open water in the usual spot off the point at the end of Duncan Road, and a seam in the middle of the lake is evident as well, perhaps opened up due to the high wind this morning. In early winter there is often open water off Duncan Point (aka Young’s Point) due to the speed of the current there. We’ll see if the current ice cover will survive the warm and wet coastal storm due to blow through here this coming Friday into Saturday.

We have historical ice-in and ice-out data for Clary Lake going back to 2001. If anyone has data for years prior to 2001 I’d love to hear about it.

November 2022 Water Level Chart Archived

11 Clary-Lake-Water-Level-November-2022

November 2022

I have archived the November water level chart (at left). Our plan at the beginning of the month had been to start dropping the lake to it’s early winter level around 14”-16” below the HWM. November is actually the month with the highest rainfall with an average of 4.58 inches but the first 10 days of the month were rain-free and we really didn’t know what to expect for the rest of the month so we didn’t take any drastic management actions, preferring to let the lake find it’s own happy level. Then the rains started first with a 1.85” rain event on the 11th followed by several more rain storms over the next 5 or 6 days which brought the lake level back up to the top of the dam by the 18th. On the 23rd we pulled the last two stop logs out of the weir and the lake level started dropping again, but two more large rain events towards the end of the month (1 inch on 27th and 1.34 inches on the 30th) brought us to 5.53 inches for the month and despite having opened the gate ¾ of a foot, the lake level rose back up to the top of the dam. We ended the month with a full lake and a full inch above November’s average rainfall. This brings us to 44.29 inches for the year to date, 3.67 inches more than average. Needless to say, the drought is over for this year. Continue reading

May 2022 Water Level Chart Archived

5 Clary-Lake-Water-Level-May-2022

May 2022

I have archived the May 2022 Water Level Chart (at left). From the beginning of the month on we saw an abrupt change from the above-average precipitation which has been the norm for the first 4 months of the year, almost as though someone had turned off the spigot! Total rainfall for the month was only 1.34 inches, well short of the normal 3.71 inches. Because we were 3.78 inches above normal at the end of April, we’re still 1.41 inches ahead of where we’d be in a “normal” year. However, simply looking at total precipitation gives you an unrealistic picture of actual ground water conditions: the fact of the matter is, the entire coast of Maine including Clary Lake is considered to be “Abnormally Dry” by the USDA Drought Monitor program. Continue reading

Lake Water Quality Monitoring Resumes for 2022

Clary Transparency

Kelsie French and I resumed our water quality monitoring efforts for 2022 on Saturday May 14th, a little later than originally planned due to circumstances which all seemingly conspired to keep us off the lake. We’re back in the saddle now however and plan to visit Clary’s deepest spot to collect data every couple of weeks this season. Continue reading

April 2022 Water Level Chart Archived

4 Clary-Lake-Water-Level-April-2022

April 2022

I have archived the April 2022 Water Level Chart (at left). April has been a very cold, very wet, and very windy month! The above-average precipitation with which we started the year has continued through April in a big way: we received fully 5.64 inches of rain in April or 1.77 inches more than the normal rainfall of 3.87 inches, fully 3.78 inches beyond where we would normally be on this date. We have received literally 5 months of precipitation in only 4. Impressive.

Not surprisingly, the lake level remained high for the month, staying somewhere between the top of the dam and the HWM for most of the month. It was quite stable really, fluctuating only a little over 4.5 inches from high to low. Only twice during the month did the water level rise above the high water mark, and at that only briefly. I love stopping by the dam and seeing water dribbling over the top of it. Continue reading

02 March 2022: Ice Berms & Pressure Ridges

With all the attention on Clary Lake ice this spring, it seems fitting to post this article I’ve been working on for awhile, yet another in our Continuing Education Series, based on the premise that informed people make better Lake Stewards! This post is on Ice Berms and Pressure Ridges and the science behind them and will be added under the Programs & Education menu heading.


IMG_1150_compressedI received a few inquiries about ice berms and pressure ridges in response to my post about February water levels so I thought I’d provide a little more information about these interesting phenomena and the science behind them. Imagine the forces at work that were responsible for the buckled ice in the photo at left! First we need to learn more about how water changes and what happens to it as its temperature changes.

Water becomes more dense (heavier) as its temperature drops, causing it to sink below warmer water: cold water sinks and warm water rises. We all know this much from going swimming and encountering that cold layer of water 4-5 feet below the surface. As its temperature drops, water continues to become more dense and continues sinking below warmer water until it gets down to about 39° F. Then something unexpected happens:  as the water cools, the molecular motion continues to slow down and as the water starts to assume the crystalline lattice structure that is ice, the distance between the molecules actually increases. The freezing water, rather than continuing to become denser, actually begins to expand, becoming less dense, causing it to float (it is this expansion as it freezes that ends up breaking water pipes). By the time water reaches its freezing temperature of 32° F (0° C) and changes to ice, it has expanded approximately 9% from its maximum density and a complete inversion from the usual summertime temperature stratification takes place. In the winter when the lake is ice covered, the coldest water is right under the ice and the temperature rises as depth increases so the warmest (and densest) water is at the bottom of the lake. This is completely opposite of what we see in the summer time with the warmest water at the surface and the coldest water at the bottom. Continue reading

01 April 2022: Unidentified Animal Sighted on Clary Lake

I spotted this Clary Lake critter this morning when I was out checking my rain gauge. At first I thought it was a goose but the sound it made wasn’t goose-like at all. Sounded more like… I dunno. It was weird. It didn’t stick around. Fortunately I was able to find a picture of it in the webcam archive. Anyone have any idea what this is?

March 2022 Water Level Chart Archived

3 Clary-Lake-Water-Level-March-2022

March 2022

I have archived the March 2022 Water Level Chart (at left). The above-average precipitation with which we started the year did not continue into March, the month’s precipitation of 3.31 inches fell about 1/2″ short of the normal 3.77 inches for March. However, despite the shortfall (if you can call it that), we’re still a solid 2″ above normal for this date and the lake level in March reflects that rainy trend. Our management goal in late winter/early spring is to raise the lake level up to high spring time levels. This year we just got there a little faster than in recent years, actually overtopping the dam in late February. The lake level exceeded the HWM briefly on March 23rd. You can see this year’s water level compared with water levels from 2018, 2019, 2020, and 2021 on our Current Clary Lake Water Level Charts page (see the 4th chart down). Continue reading

13 March 2022: Early Spring Dam Management

20220309_110621-MediumWe’ve begun our Spring management activities with the aim of getting Clary Lake filled up for another boating, fishing, and swimming season, about week earlier than usual because of all the snow and rain we’ve been blessed with this year. Our spring management includes adding stop logs to the weir to start raising the lake level to it’s spring high while opening the gate to increase outflows to maintain minimum flows, and also to keep the lake from rising too quickly. It’s a balancing act made more difficult with having to second guess the weather. Because of drought conditions the previous 3 years, it has been a challenge raising the lake level in the spring while at the same time maintaining outflows. We pretty much have the opposite problem this year! After the first two months of 2022 we’re 2.5 inches of precipitation above normal for this date. The picture shows Steve Cowles on March 9th cranking open the gate the other day, with Dave Knight standing by with the folding ruler. There are 4 threads to the inch on the screw, so opening the gate 12″ means turning the gate wheel 48 turns. That’s a workout. Today, we installed the last two stop logs in the weir. You can track all the action on the 2022 Dam Operation Log.

February 2022 Water Level Chart Archived

2 Clary-Lake-Water-Level-February-2022

February 2022

I have archived the February 2022 Water Level Chart (at left). The above-average precipitation with which we started the year (January ended 0.93″ above normal) has continued throughout the month of February which saw a total of 4.16″ of precipitation (water), the effect of which has been to put us fully 2.48″ above normal for the year to date. This bodes well for ground water supplies this spring, in marked contrast to the last 3 or 4 years. We’ll have to wait and see if the cycle of summer drought has been broken. All the rain and snow we received in February resulted in the lake level rising to unseasonably HIGH levels, overtopping the dam on February 23rd and coming to within half an inch of the HWM on the 25th. Continue reading

9 February 2022: How’s This For Confusing?

Everyone knows I love charts (and maps!). They’re a great way of visualizing data. Sometimes my love of maps and charts takes me to some  pretty strange places. Here’s an example of one of those places (at left). Every time I look at this chart I have to stop and peer at it for a moment before it makes sense. Every time. And some days it just doesn’t make sense no matter how long I stare at it. This particular chart shows the water level of Clary Lake on February 8th, 2022 and the elevation of the water line on that date is 149.88 feet, or 1.29 feet below the HWM. What this chart is actually showing us is the distance the lake surface is below the top of the dam, at any place along the top of the dam, starting at the left (0 feet) and proceeding to the right (98 feet). Continue reading

January 2022 Water Level Chart Archived

1 Clary-Lake-Water-Level-January-2022

January 2022

I have archived the January 2022 Water Level Chart (at left), starting off the new year with more snow on the ground than I can remember seeing for several years. Compared to recent winters, this condition bodes well for our ground water supply come spring the ground thaws this spring and the snow melts.

Our general dam management goal in the winter is to maintain a lake level somewhere around 18 inches below the HWM. This is low enough to prevent ice damage to the shoreline around the lake yet still high enough to maintain outflows sufficient to meet the minimum flows requirement of the Clary Lake Water Level Order. To that end, we’ve been successful: the lake level is currently around -1.41 feet and outflows are around 13 cfs (cubic feet per second), slightly higher than the current minimum flows which of 11.3 cfs. If you’re unclear about minimum flows, what they are, and why we are supposed to maintain them, see Minimum Flows Explained.