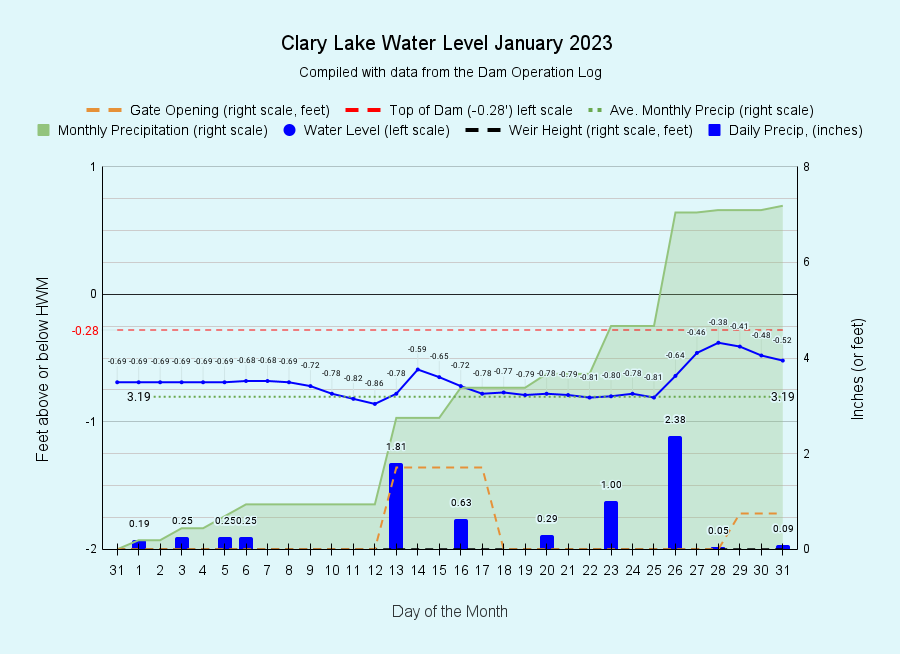
I have archived the January 2023 water level chart (at left). By far the most impressive thing about January was how much snow and rain we got! Total precipitation including rain and (melted) snow was 7.19 inches of water which is more than twice the average precipitation for January of 3.19 inches. We’re starting off the year fully 4 inches above normal for this date. This will benefit ground water supplies this coming year. Even with all the snow and rainfall however, the water level was relatively stable though it was a little higher than we like to maintain it this time of year, due to all the inflows. January and February are usually pretty sedate months from a water level management perspective but this year we’ve had to open the gate a couple of times to let out more water just to keep the lake from overtopping the dam. There’s nothing wrong with overtopping, but this time of year it leads to ice formation which makes walking on the dam treacherous. We also like to keep the lake level lower in the winter to prevent ice damage to the shoreline. Mother nature however usually has her way.
Conductivity
I have begun monitoring the Conductivity of Clary Lake water as a proxy for lake productivity. It’s fairly easy data to collect and should help us get a better handle on lake water quality and how it changes over time. Productivity is normally thought of as a good thing, but in lake water it is a bad thing: the more nutrients there are in lake water the more productive the lake is and the more likely it is to experience water quality issues such as algal growth and algae blooms such as we experienced this past fall. The chart at left shows Conductivity, Average Conductivity, rainfall, and Total Dissolved Solids (TDS) discussed below. You’ll find this Conductivity chart on the Current Water Level Charts page.
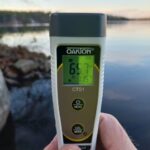
Conductivity is a measure of the ability of a substance to pass an electric current. In the case of water, it’s a direct measure of dissolved salts and other inorganic chemicals which conduct electricity. Total Dissolved Solids (TDS) is another way to look at lake productivity. TDS is a  measure of the combined dissolved content of all inorganic and organic substances present in water in molecular ionized, or granular (colloidal or suspended) form. The Conductivity of a water sample is obtained with a handheld meter which is immersed in the water and which measures the amount of electricity that passes between two electrodes. Conductivity of fresh water is relatively low and is therefore measured in microsiemens per centimeter (μS/cm). The meter we have (picture at left) doesn’t actually measure TDS, it calculates it by multiplying Conductivity by 0.60 with the result being a measure Total Dissolved Solids in parts per million (ppm).
DEP has been measuring Conductivity of lake water as a proxy for lake productivity for years, and data for Clary Lake from 1976 through 2017 is available on the Lakes of Maine website. I plotted this data on the chart at left and you can see that Conductivity has gradually been increasing over the years (I added the values for 2022 and 2023). It’s a little early to make any definitive statements, but based on the historical data available so far, there does appear to be a correlation between higher levels of conductivity and the occurrence of algal blooms that plagued us between 2012 and 2015 and this past fall.
My interest in Conductivity actually started out as an interest that developed this past fall of the impact road salt might be having on our lake water quality. Road salt is primarily Sodium Chloride, (NaCl) and is spread on roads to prevent icing. Road salt in our environment is clearly a serious concern, it can badly pollute ground water. However, while higher conductivity is clearly bad for water quality, the overall impact of road salt on our lake water quality and the extent to which it increases Conductivity is unclear at this time.
I’m planning on recording Conductivity data roughly once a week throughout the year and will take core water samples for testing during our regular bi-weekly water quality monitoring activities this summer. Stay tuned!


