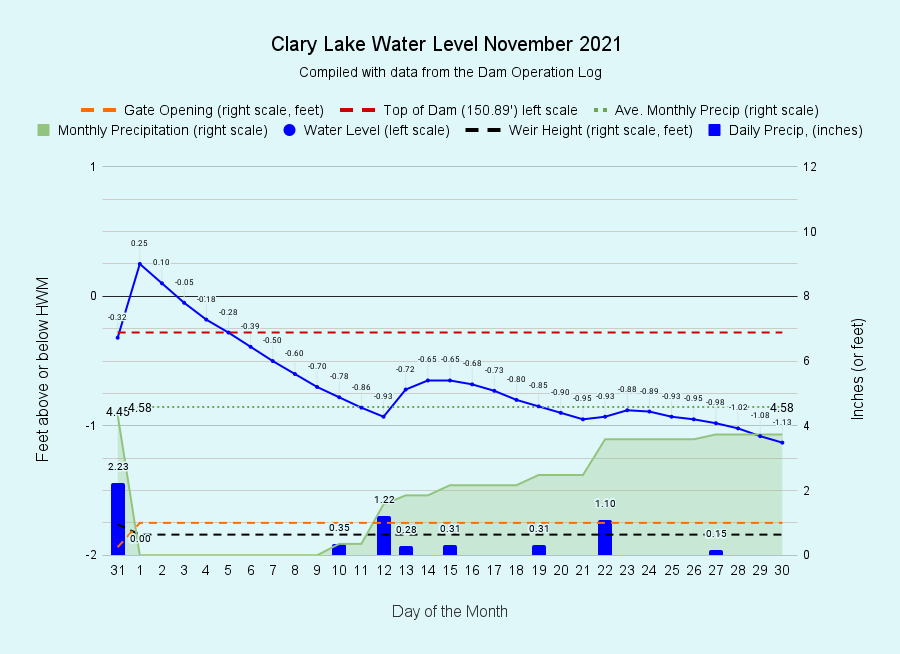
I have archived the November 2021 Water Level Chart (at left). The lake level in November was like a roller coaster ride. Our general plan for a dam operations in November is to get the lake level down a foot or so below the HWM in preparation for the lake freezing over sometime in December. A large rain event on the last day of October however brought the lake up to +0.25 ABOVE the high water mark, the highest the lake has been all year! On the first day of November we pulled one of the three remaining stop logs and opened the gate 1.05 feet to drain off some water which resulted in the lake level dropping 1.18 feet over over the next 12 days. Over the rest of the month we had numerous rain storms including one of 1.22 inches on the 12th and a 1.10 inch storm on the 22nd. This rainfall kept the lake level up higher than we would have liked. We ended the month with the lake level down 1.13 feet.
All told we received 3.73 inches of rain for the month which seems like a lot but was actually 0.85 inches less than the normal 4.45 inches for November. For the year we’re still 2.12 inches above normal thanks to excessively heavy rainfall in July (8.99 inches) and September (8.50 inches). While 2021 has seemed like a “wet” year, in fact 8 of the past 11 months actually saw below average rainfall. That said, thanks to July and September, it looks like we’re going to end the year with about the normal amount of precipitation.
We’ve been watching the lake level closely this past week, wanting to get the lake down where it belongs this time of year without actually going too far. It’s sort of like playing a game of chicken! Today (December 2nd) with the lake down almost 15 inches we decided it was time to slow the outflows. To that end, we closed the dam’s gate and pulled the last two stop logs. Total outflows are now 17.2 cfs (cubic feet per second), just a wee bit higher than the minimum flows of 15.5 cfs. Our water level goal for December is somewhere around 18 inches below the HWM.
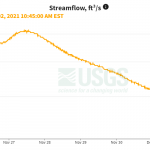
I always enjoy seeing how our lake level management activities affect the water level in the Sheepscot River, and I’ve written about this before. Closing the gate and pulling the stop logs this morning at 8 AM resulted in a drop in outflows of around 23 cfs. The Sheepscot River gage recorded a drop in river flows just after 8 AM of about 26 cfs (see chart at left). That’s pretty close! I occasionally get an email from someone at USGS who notices an unexplained blip in the river gage and is wondering if it was us letting out more or less water. Quite often we’re the reason 🙂


