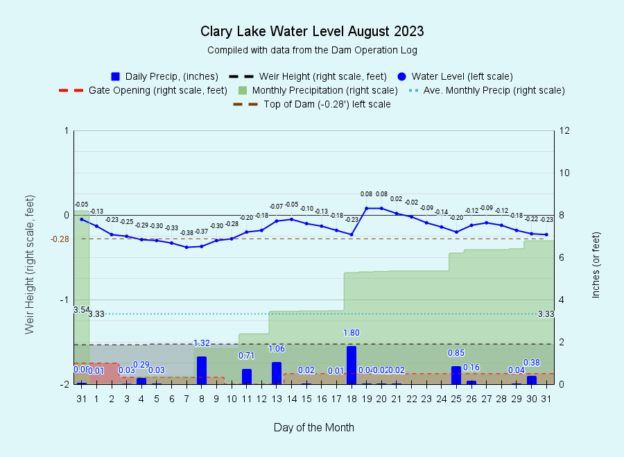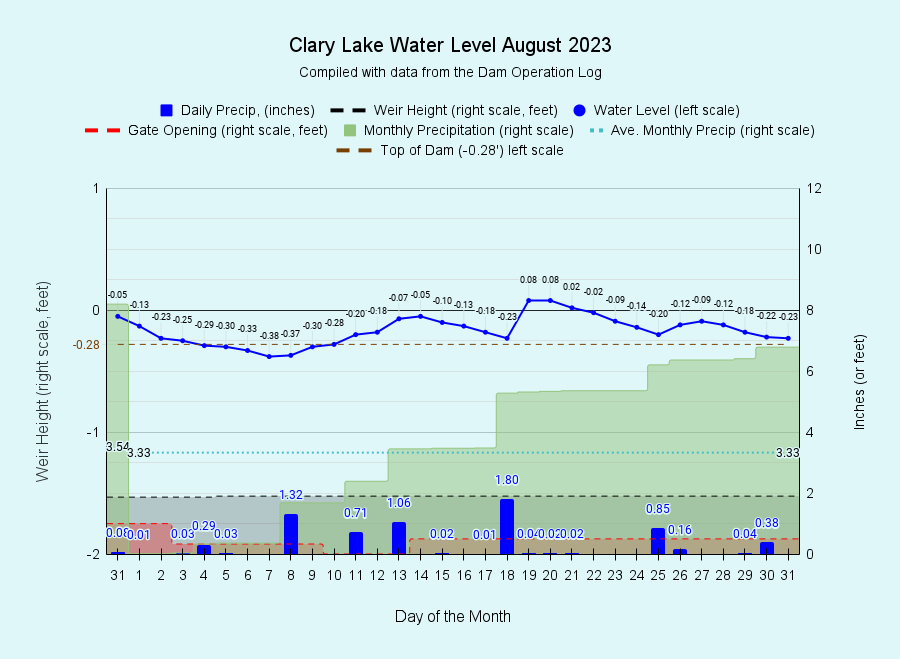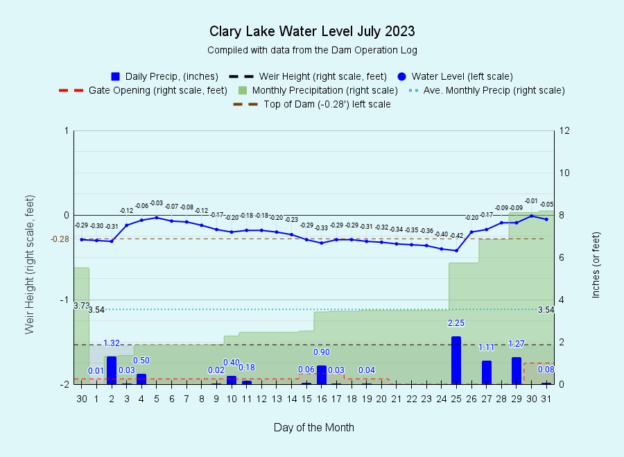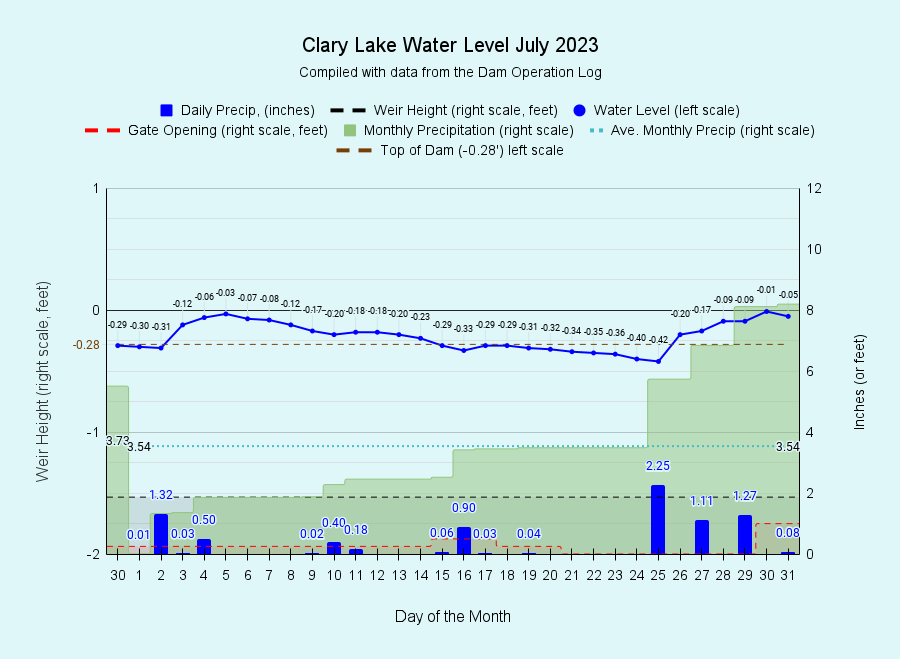
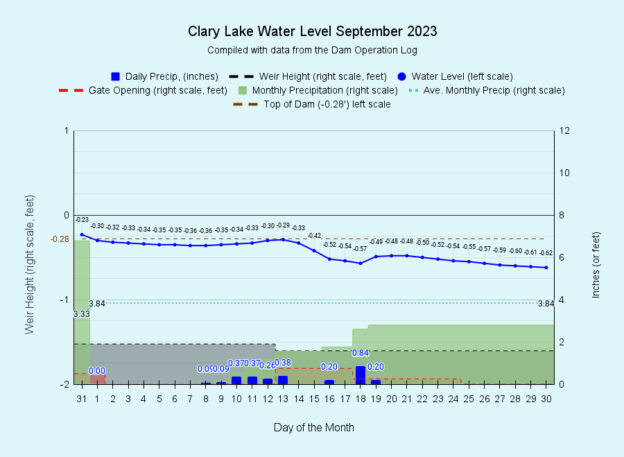
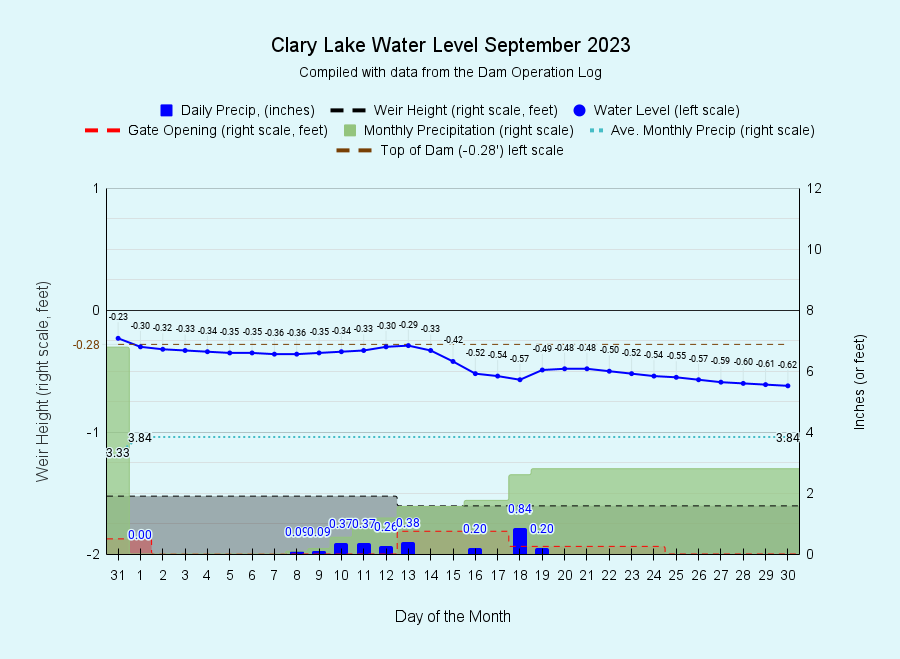
I have archived the September 2023 water level chart (above, and at left). The rain we’ve come to expect this Summer just didn’t materialize last month with only 2.80 inches of rain falling (73% of normal) or a full inch less than the 3.84 inches we would normally receive in September. An obvious impact has been the gradual drop in water level. That said, who didn’t like the extended stretch of warm dry weather in September? Of the first 9 months of 2023, only 3 months had less than the normal amount of precipitation: September (73% of normal), March (67% or normal) and February (52% of normal). The month with the highest precipitation was July, with 8.2 inches (232% of normal) followed closely by January with 7.19 inches (225% of normal). Despite shortfalls in those three months, at the end of September we were still 12.65″ ahead of normal. To better grasp how big a differential that is consider that our average annual rainfall is 44.06 inches, and we’re already there- we’ve already received more than that. Even if we were to receive NO MORE rain or snow for the REST OF THE YEAR, we’d still end up a hair above normal annual rainfall. That is how far above normal precipitation we are this year. The overall precipitation statistics for 2023 are impressive. You’ll find all kinds of data and charts on the Precipitation sheet of our Clary Lake Dam Operation Log. Continue reading