The other day I posted the September Water Level Chart and I speculated at that time that I thought the lake was about as low as it is going to get. Tim Harkins had related how he’d tried to get into the channel and couldn’t find it. Well today I headed out in my kayak to the northwest end of the lake to try to find my way into the channel. I couldn’t. I could see where the water was flowing, but I ran aground in about 3″ of water trying to follow it. I didn’t push it because I didn’t want to get stuck.
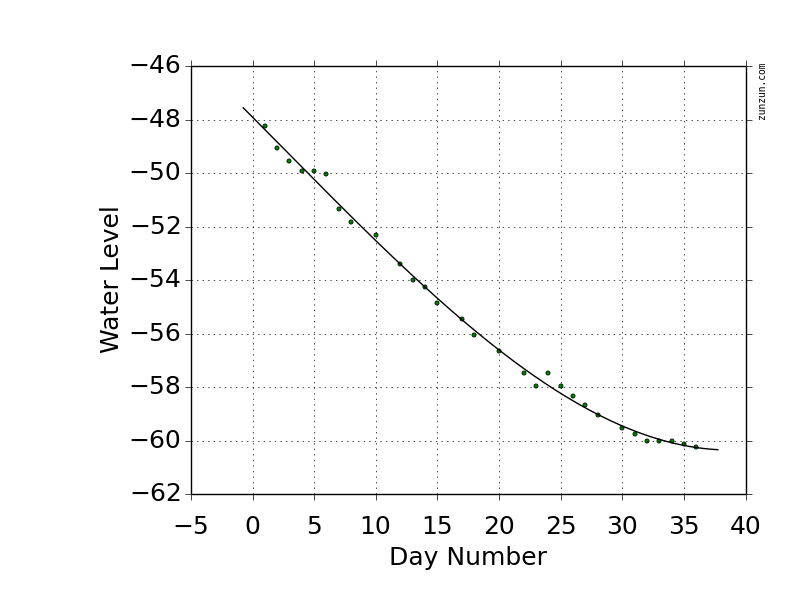
The rate at which the lake level has been falling has been dropping off rapidly and as the following plot shows, it has about hit bottom:
The chart shows 36 days of falling water levels starting on August 16th and extending through today. Now I’m not saying the lake can’t fall any lower, but from the looks of that curve it is unlikely. Theoretically it could drop another couple of inches if we continue without receiving any rain, but that is unlikely. Without any rain, springs and water seeping out of the water table is sufficient flow to offset the 1/8″ per day the lake is falling.
What it interesting is that back in April 2012 the lake level fell to 62.25″ below the top of the dam, 2″ lower than it is now. It is hard to imagine the lake falling that low again. I suspect the sediment “dam” blocking the channel is the result of ice pushing against the lake bottom.

