
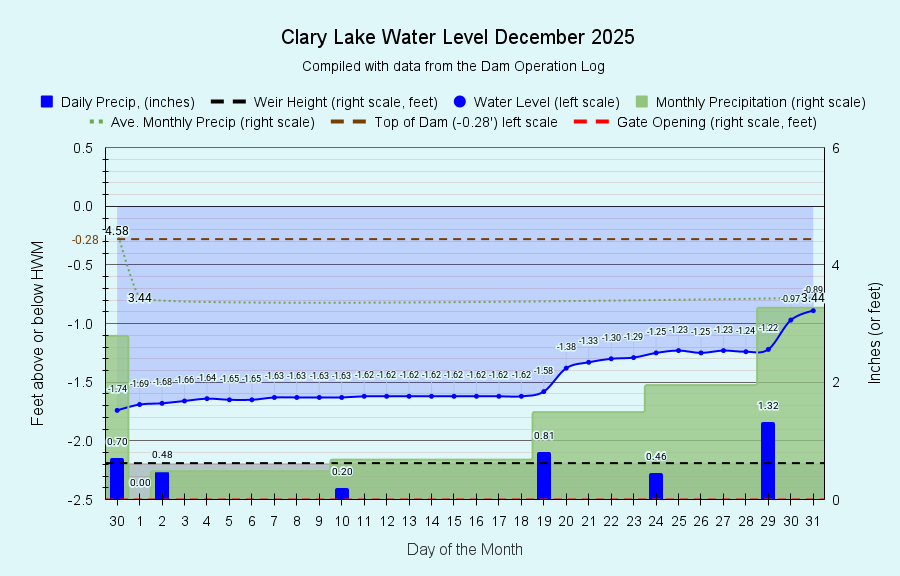
 And so we come to the end of another year. I have archived the December 2025 water level chart (above, and at left) and also updated the 2025 Water Level Charts gallery with all the relevant 2025 charts for Clary Lake (and probably a few irrelevant ones as well) showing the year in numbers: lake level, transparency, dissolved oxygen, temperature, rainfall, flushing rate and retention time, etc. I do hope you’ll take some time to review the charts.
We received 41.21 inches of precipitation for the year, 2.85 inches short of the average annual rainfall of 44.06 inches. 2.85 inches isn’t a huge shortfall but because of the timing of the precipitation we did receive (most of it fell in March, April, and May), we still ended the year in Severe Drought.
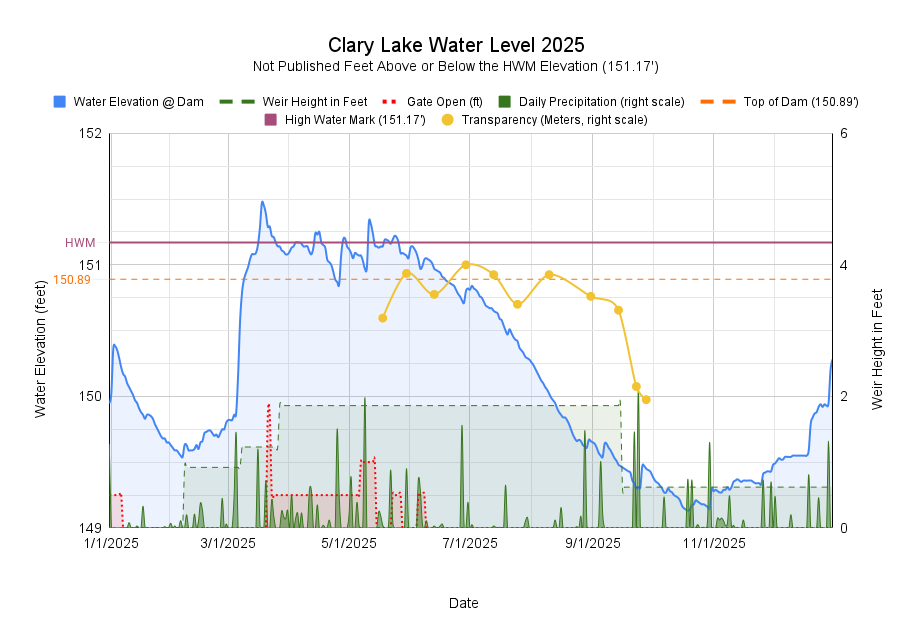
I’ll leave you with the 2025 water level chart which dramatically shows the falling water level and rainfall amounts. This year I added the secchi disk readings (in meters, right hand scale) that we recorded last season; you can see that as the lake level fell, so did lake transparency, ending up in late September just under 2 meters- officially an algal bloom: