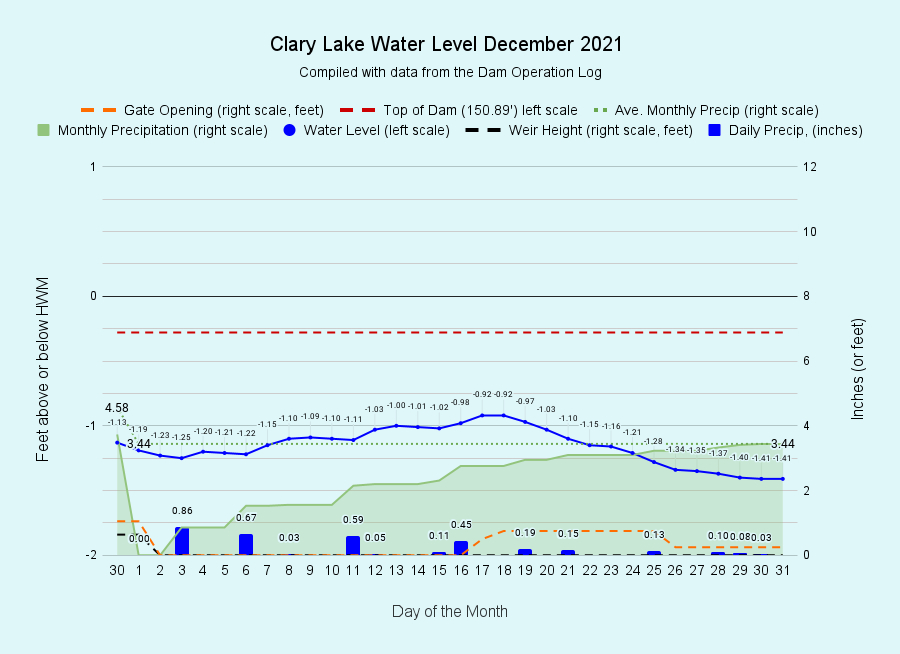
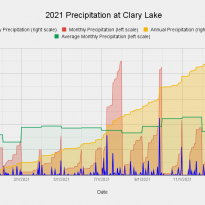
I have archived the December 2021 Water Level Chart (at left), bringing 2021 to a close. Our general goal in December is to get the lake down to about 18 inches by the time it freezes over, without overshooting the mark. We have after all only 24 inches to play with. As it turns out, the lake froze over on December 20th with the lake level down just 1 foot. Precipitation for the month was 3.44 inches, average for December, bringing us to 46.18 inches for the year, 2.12 inches more than average. It is only because of the excessive rainfall we received in July (9 inches) and September (8.5 inches) that we ended the year a bit ahead of average precipitation because for most of the rest of the year, we fell short of monthly averages. And that’s about all I’m going to say about December. It’s a New Year.
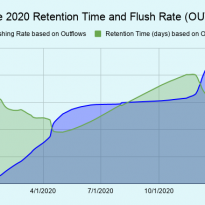
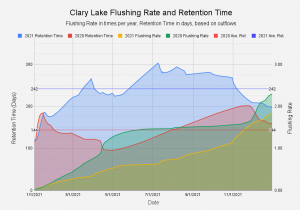
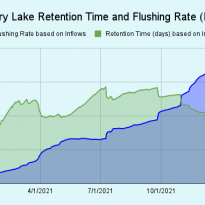
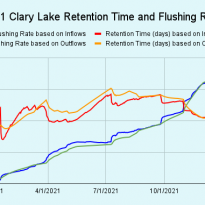
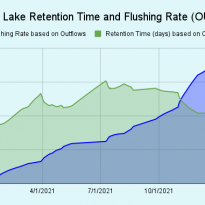 One big difference between 2020 and 2021 turned out to be the flushing rates and retention times. In 2020 we had a flushing rate of about 2.3x with a retention time of 140 days. In 2021 the flushing rate was 1.8x (the same as the published rate for Clary Lake) with a retention time of 240 days. This is in effect a measure of the amount of water that passed through Clary Lake: in 2020, a total of 16,632 acre feet of water passed through the lake, in 2021 that figure was significantly less, only 13,274 acre feet. The lower flushing rate in 2021 very likely had a beneficial effect on water quality.
[UPDATE]: I was so intrigued with the difference in flushing rate and retention time for 2020 and 2021 that I decided to graph them to make the differences more evident. Here’s the result:
I’ll add data for 2022 as it becomes available.
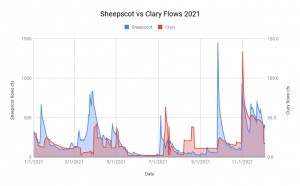
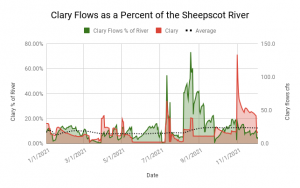
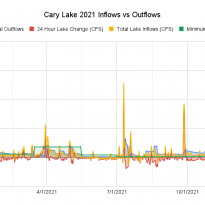
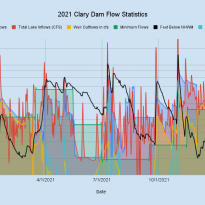
I can’t end 2021 without highlighting an interesting but ultimately useless bit of data analysis I wasted time on this year. Everyone knows that I love charts. If you don’t know that by now, then you simply haven’t been paying attention! I’d like to show you two fascinating but useless charts I made this year. First a bit of explanation. I have long thought it would be cool if I could somehow correlate the flows from Clary Lake with the flows in the Sheepscot River as measured at the Sheepscot River Gaging Station which is located at the foot of Grand Army Hill. It turns out you really can’t correlate the two flows in any reasonable fashion for two primary reasons. First, because the hydrological characteristics of the Clary Lake watershed (9.9 square miles) and that of the larger Sheepscot River watershed (142 square miles) are quite different. Clary should contribute 6.9% of the water measured at the gaging station but that figure actually varied from a low of around 1% to a high of 60% with an average of around 12.4%. Sheesh. Second, nobody actually controls the flows on the river, but we do in fact do control the outflows from Clary Lake so it is largely our own management activities that make correlating the two flows almost impossible. It would be nice if Clary outflows were always 6.9% of Sheepscot River flows, but I guess that would be too easy! Anyways, here are two charts I made while investigating whether a correlation between lake and river flows exists. One shows Clary Flows as a percentage of the Sheepscot River flows. The average turned out to be 12.43%. The other is a simple visual comparison of the two flow amounts which I did to see if anything jumped out at me. Nothing did:
 |
 |
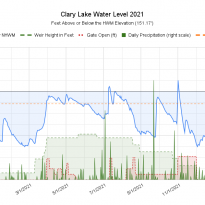
Here’s the 2021 Water Level Chart gallery:
Happy New Year everyone 🙂



Testing my new recaptcha setup.