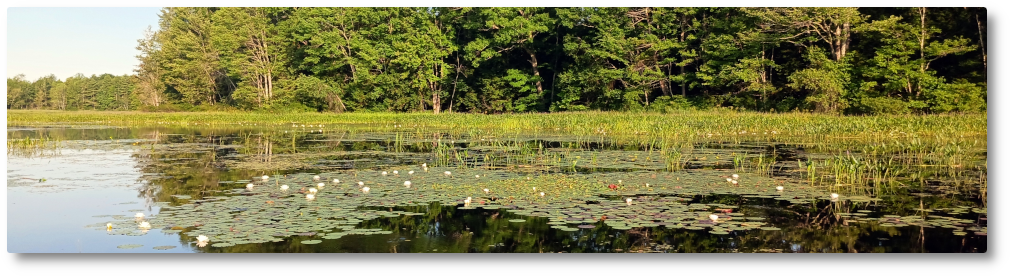

 We have declared ice out on Friday, March 8, 2024. Our records go back to 2001 and this is the earliest date we’ve recorded. The previous record was March 13, 2016. There’s still a little skim ice down in the marsh by the boat launch (likely a result of overnight freezing temperatures) and a few loose floes still in the cove on the south shore in front of David Giampetruzzi’s camp (it’s always the last to go) but the lake itself was effectively and substantially free of ice by the end of the day Friday. The picture above and at left was taken Thursday afternoon.
Ice out occurred earlier than any of our ice out contest guesses so technically nobody was “closest without going over.” In such a situation, rather than saying “Sorry, no winner this year” we feel justified in changing the rule to simply “closest” and “next closest” for first and second place which makes Gayle Knight with her guess of March 10th the first place winner of a $25 Jefferson Scoop gift certificate. Some of you will recall that also Gayle won the contest last year. We’re not quite sure how she managed to win our ice out contest two years in a row… she’s either cheating or she’s very lucky. She claims she just really really likes ice cream. We’ll go with that explanation 🙂
 Much to his chagrin, Tristan Tabor of Lake Stewards of Maine has come in second with his guess of March 11th. I’ll be mailing him the second place prize, a laminated copy of our Clary Lake Depth Map (pictured at left). Tristan is the Water Quality Program Director, Technical Director, Aquatic Scientist at Lake Stewards of Maine and is a great guy. I can honestly say he is NOT HAPPY to have won any prize at all in our ice out contest, let alone second prize. He is concerned as we all should be at the implications that a warming climate will have on lake water quality.
Clear Evidence of a Warming Climate
Normally, for statistical analysis of climate data one wants data covering as long a period of time as possible. Our ice in and ice out records only go back 24 years to 2001 but even over that short period of time we’re still able to detect a warming trend in our climate, as this chart of ice in and ice out dates shows. You can detect that the average of ice in dates (represented by the straight red line) trends upward ever so slightly, indicating that ice in is on average occurring a little later every year. Likewise, the average of ice out dates (represented by the straight blue line) trends downward ever so slightly indicating that ice out is on average occurring a little earlier every year. However, the number of ice free days (the straight yellow line) is very clearly rising since it’s reflecting both later ice in and earlier ice out dates i.e., it’s being stretched in both directions:
 So this brings our 2024 ice out contest to a close. Many thanks to everyone who participated.