
October 2016
I’ve archived the October 2016 Water Level Chart (at left). The most notable feature of the October chart, like most of the other charts this past summer and fall, is how little the water level varied over the course of the month. Despite having received 3.45″ of rain in October, the total fluctuation from high to low for the month was only 1.68″ which is to say the lake pretty much stayed down around -69″ below the top of the dam for the entire month. It ended the month at -68.28″ below the top of the dam. This is all neatly explained by a deeply depressed water table and the ongoing drought conditions, but still, it defies common sense.
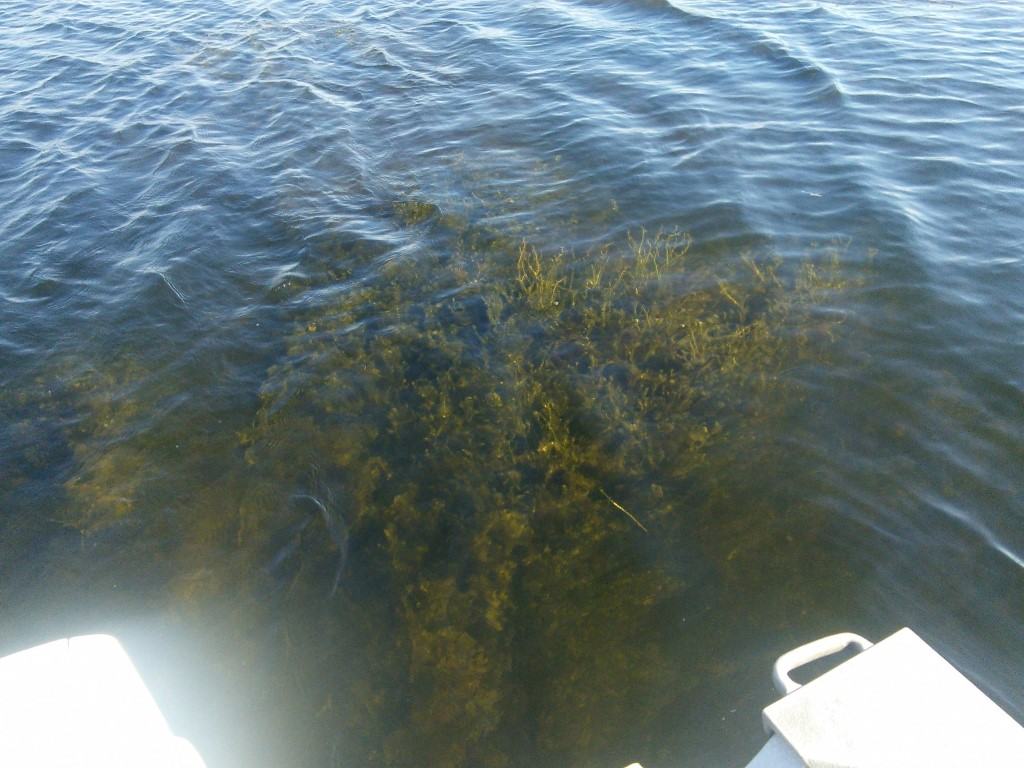
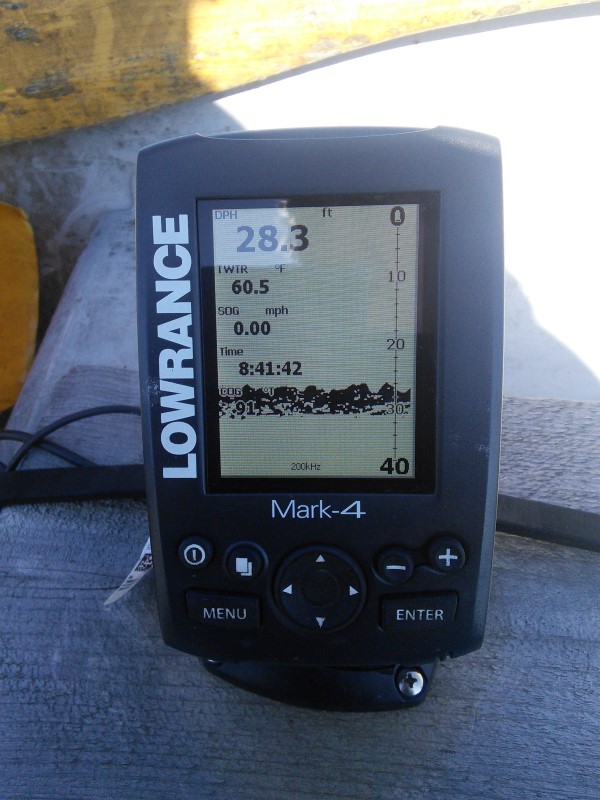
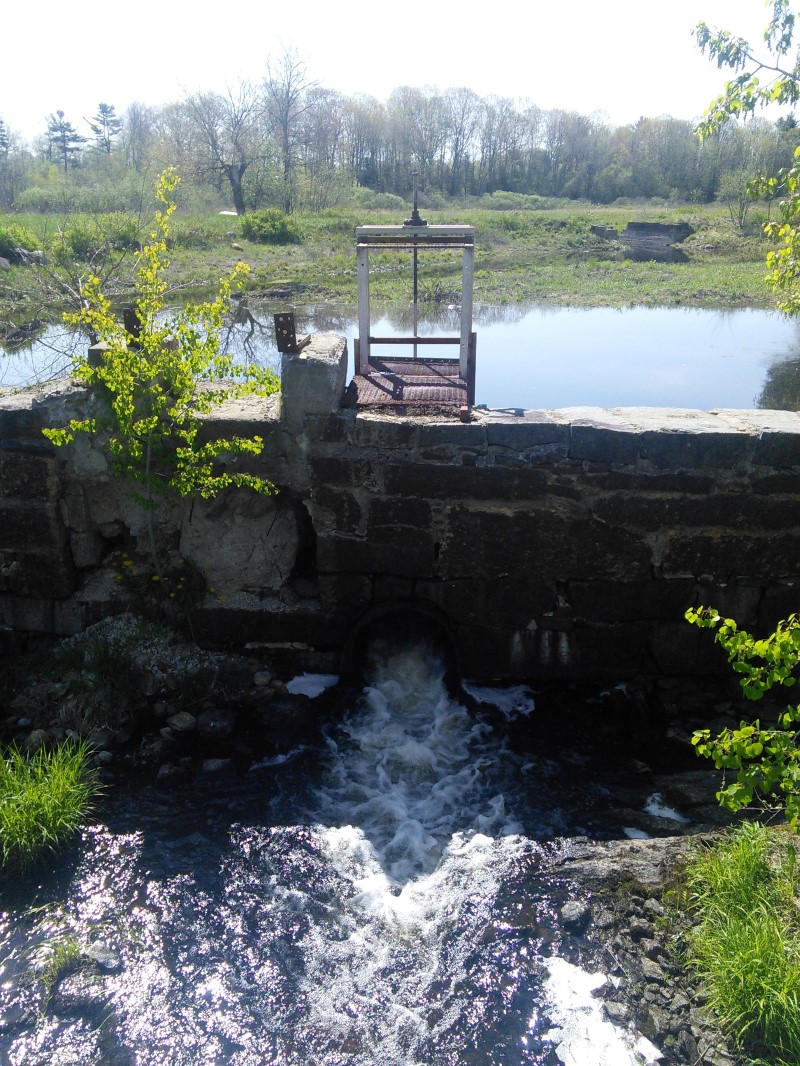
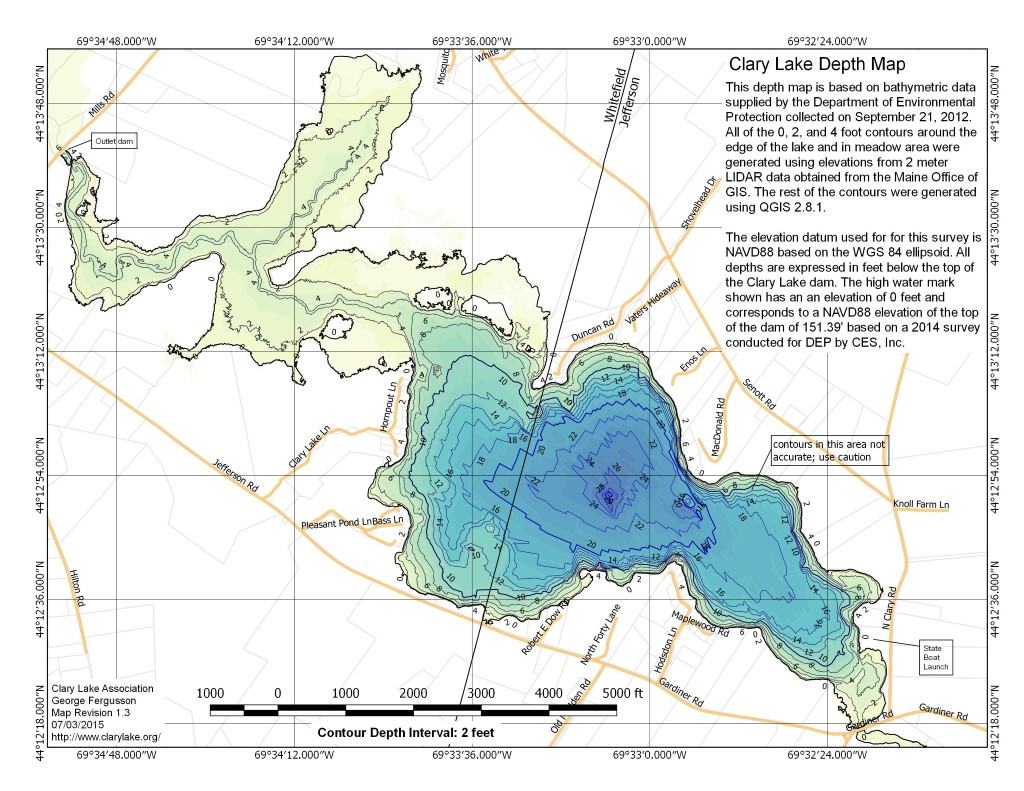
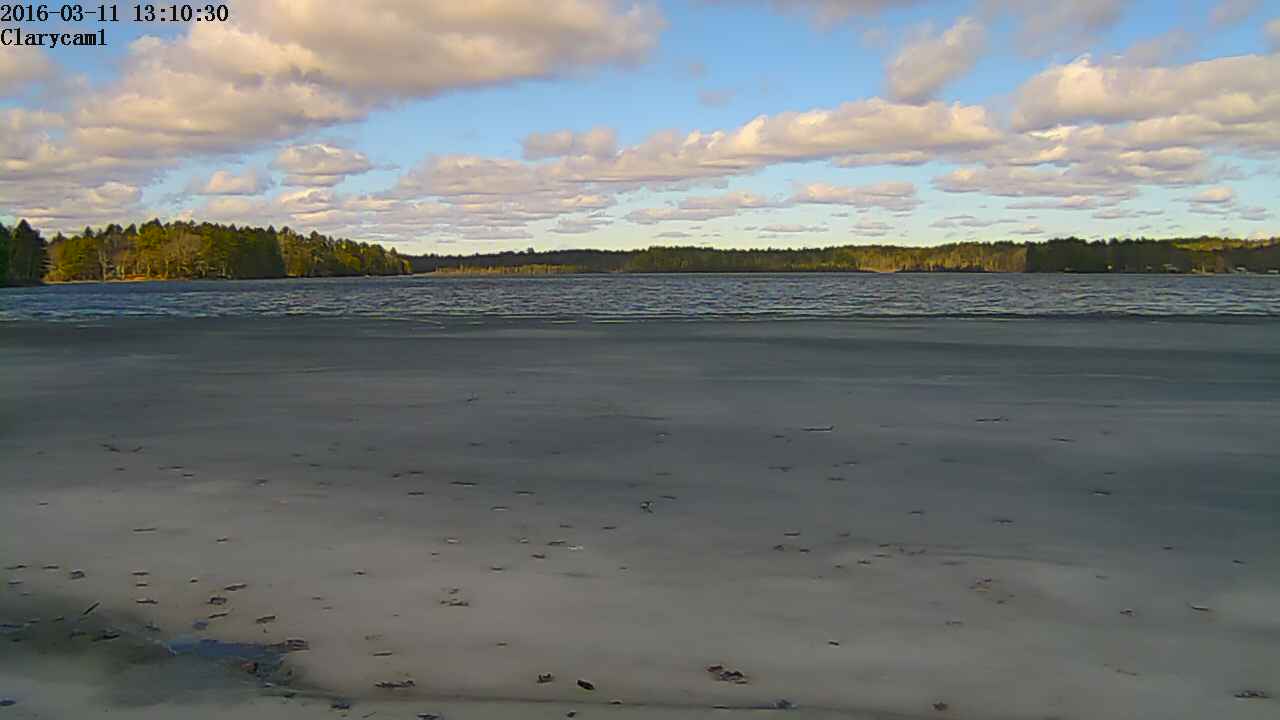
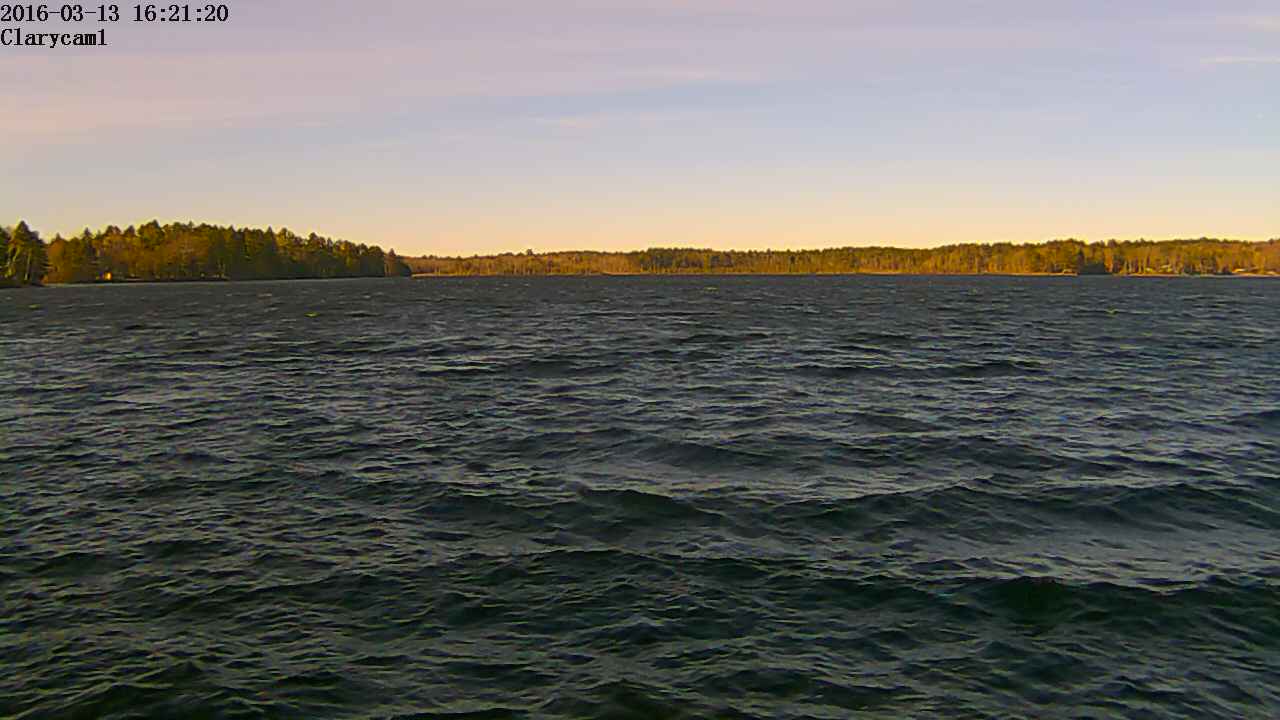
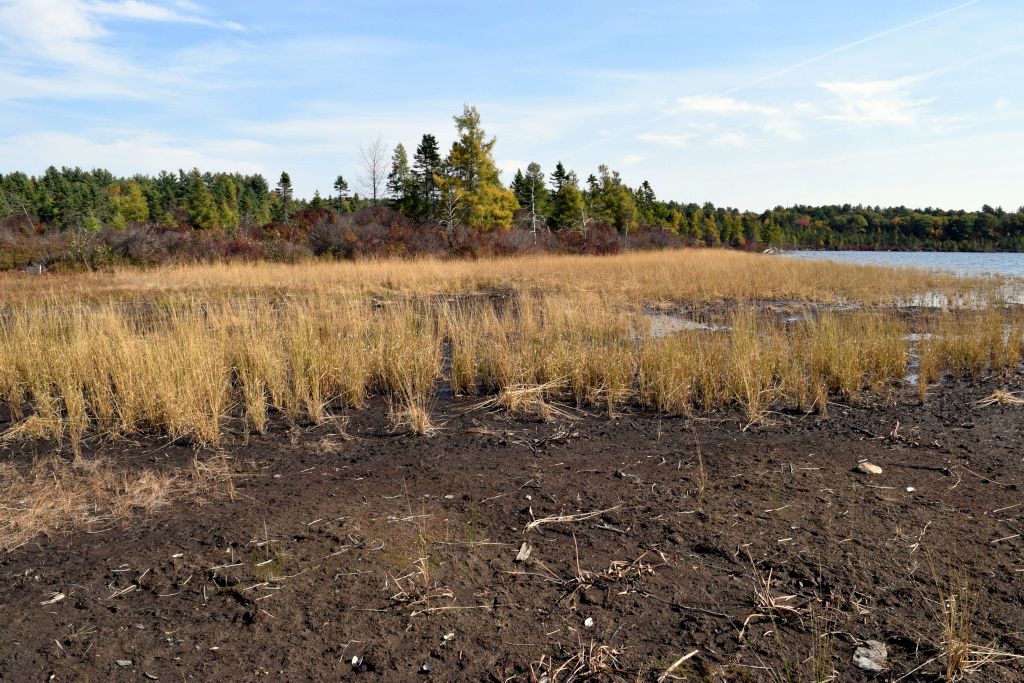 You’ve also never seen the lake this low. On October 20th I recorded the lowest water level reached to date, a mind-boggling -70.0″ below the top of the dam. I took the picture at left a few days earlier when the lake almost that low and as you can see, the outlet channel is high and dry, almost dry enough to walk across. At -70″ below the top of the dam, the volume of Clary Lake is only 54.85% of full and its area, at 425.3 acres, is down to 45.6% of it’s size when full. These are mind boggling numbers. For what it’s worth, the lake didn’t stay that low for long, 0.91″ of rain the following day brought the lake up a whopping 1/4″.
As mentioned, we received 3.45″ of rain in October which sounds like a lot but the average for the month is 4.37″. At a total of 28.82″ so far this year, we’re still 5.48″ short of rainfall for the year so far.


 I’ve
I’ve 