Category Archives: Technical Lake Stuff

02 May 2015: Clary Lake water quality monitoring resumes

IMG_20150430_082353.jpgWater quality monitoring for 2015 resumed on April 30th. David Hodsdon and I tried to get out the previous week but the wind was so strong my anchor was dragging and we couldn’t stay in one place. This date is about average for the first data collection exercise of the year. We’ll try to get out every 2 weeks throughout the boating season. This also marks David Hodsdon’s 40th consecutive year of water quality monitoring for the VLMP. Quite a record!

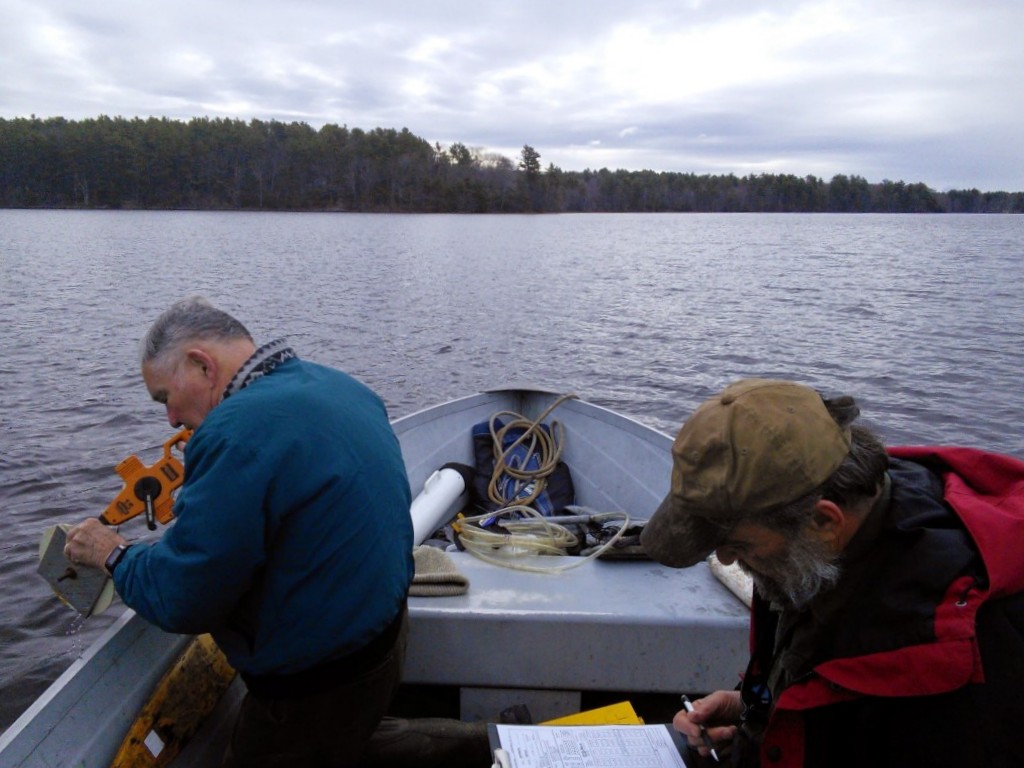
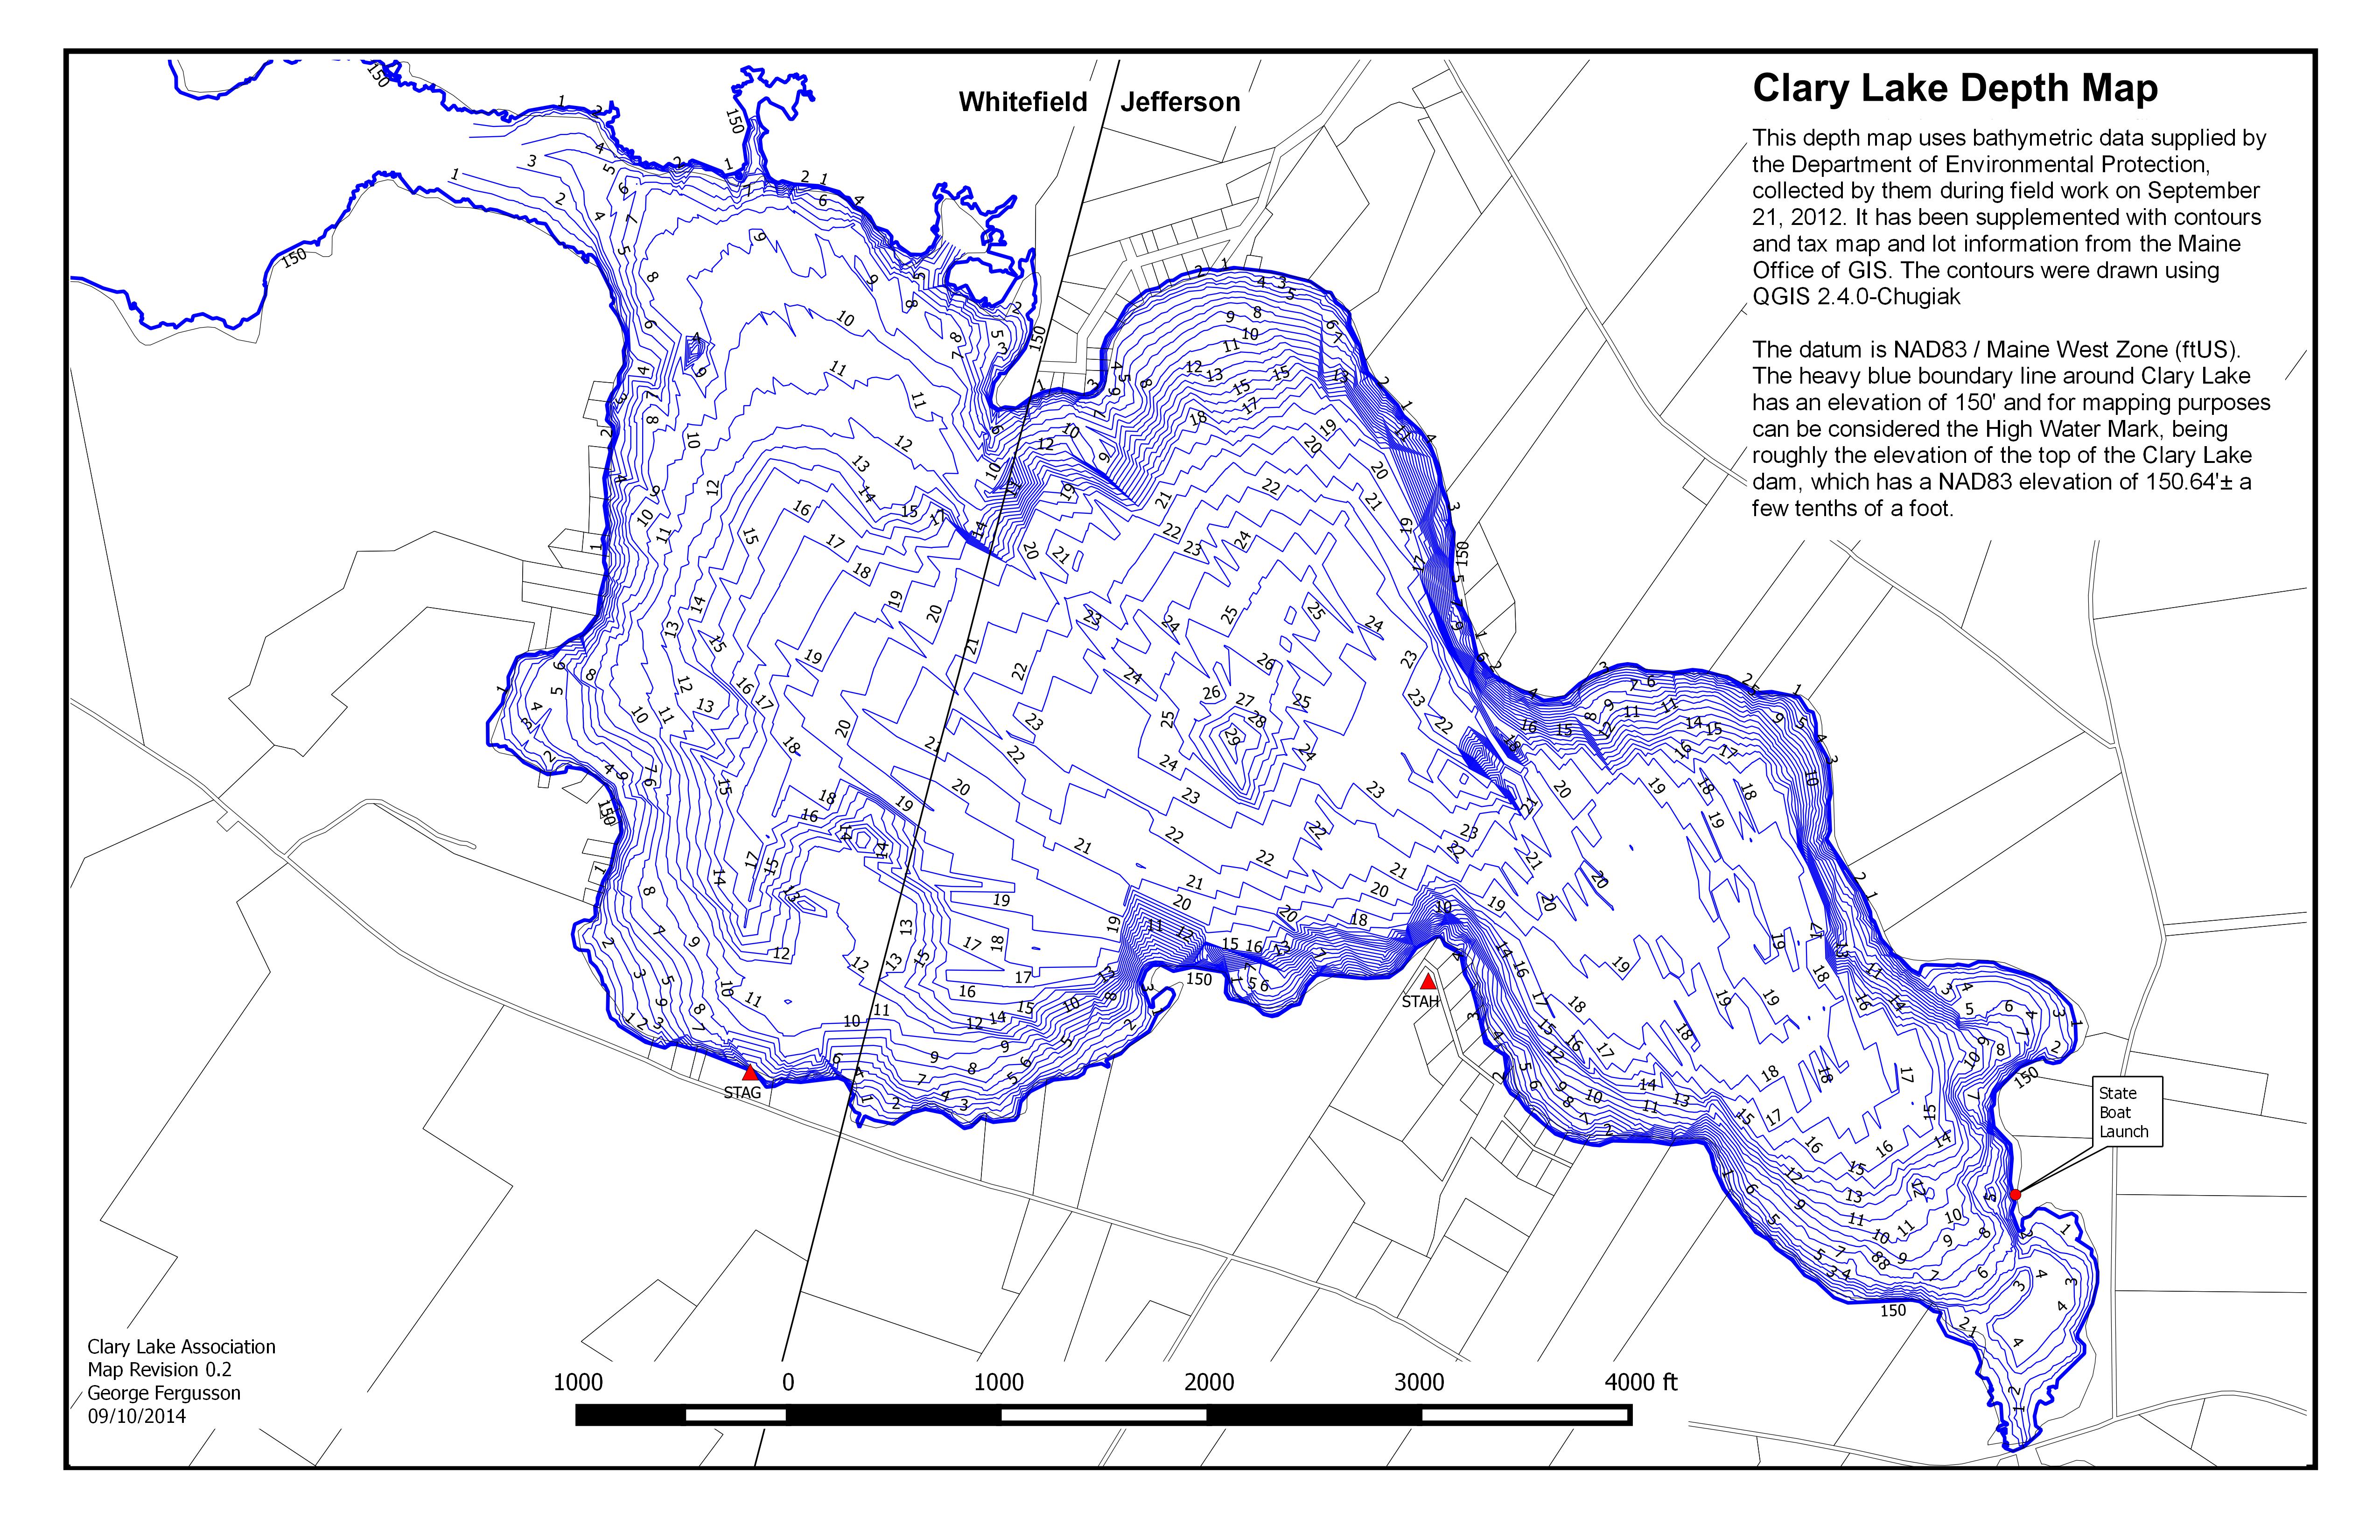
The water was quite clear with a secchi disk reading of just over 11 feet. You can view current data and that for recent years on our Clary Lake Water Monitoring Data page (we also have data back to 1975 when David Hodsdon started his water quality monitoring efforts, available upon request). Our collection station is over the “deep hole” which we locate with a GPS and the data we normally collect includes air temperature and wind speed, water depth, clarity (secchi disk reading), and dissolved oxygen and temperature measurements at the surface and at 1 meter increments all the way to the bottom of the lake. Approximately 3 times per year we take a core water sample for phosphorus which we send off to the State for analysis. We took one this time.

You can read more about the VLMP and our water monitoring efforts on the Volunteer Lake Monitoring Program page.

01 March 2015: Resumed water level measurements, sort of

Well, not really. I did go over to the dam today and took the picture at left showing some open water between the railroad bridge abutments. By carefully measuring the image using known distances for the length of the southerly abutment (~23′) and the distance between the abutments on the west end (~17′) and after adjusting for the skew angle (simple trigonometry) I came up with a water level value of  approximately -48″ below the top of the dam (which is probably within ±3″ of the true value). This value is consistent with the amount of water I observed flowing out of the dam, which wasn’t a whole lot. It is also within a couple of inches of where the lake level was at the end of January when I halted water level measurements. I think the lake level has been fairly stable: while there wasn’t a lot of runoff last month, there’s a lot of snow piled up on the lake and that’s almost the same thing.

At the end of the description of the above picture there’s a link to a full sized version (or click here) on which you can easily see dark stain on the abutment representing the approximate normal high water line, about 1′ below the top of the abutment.

2 waterlevelchart_February2015.gifI also added a chart for February 2015 (using precipitation data from the Weather Underground) to the 2015 archive more or less for a place holder since there really isn’t much to look at on it, and I updated the Current Water Level Charts page with a rudimentary chart for March. I’ll try and get an approximate water level more or less weekly until conditions allow me to resume regular measurements. I expect when our awesome 48″ snow pack melts we’re going to see a substantial rise in the lake level.

While I was at it, I corrected the mislabeled January 2015 water level chart which unfortunately claimed to be for December 2014. Nobody noticed, or else nobody bothered to point it out to me.

Think spring!

01 March 2015: A clear and cold start to the month

Schedule_20150301-063800.jpgIt was a clear and cold -15° F this morning when I got up, pretty chilly for the 1st day of March. As cold as it has been this winter, it appears the channel has remained open. You can see in the web cam image from this morning that there is some fog up in the northwest end of the lake where the channel starts. This indicates open water. I’ve seen this phenomena off and on this winter when conditions were right. Sure hope the weather starts warming up soon.

I had hoped to resume water level measurements today but the weather is going to have to moderate a lot and a whole load of snow is going to have to melt before I venture down to the lake. There’s easily 6′ of snow on my shoreline and I have no inclination to try floundering through that to find the ice, and then have to chop a hole in it, find my bench mark, yada yada. I will make a point of swinging by the dam today and guestimate the water level  at the railroad abutment, that should give us an idea within a few inches of what the lake level is.

January 2015 water level chart archived

1 waterlevelchart_January2015And so we come to the end of another month. I’ve archived the first chart of 2015 in a new album “2015 Water Level Charts.” Due to heavy rains in December combined with frozen ground, significant runoff brought the lake level up to 24″ below the top of the dam at the start of the month, right where it would be this time of year if the water level order were being followed. The water level has steadily fallen since the 1st of the year and ended the month at 46″ below the top of the dam.

Like last year, I have decided to halt further water level measurements for the month of February. Weather permitting I’ll resume water level measurements on or about March 1st.

2014 Water Level Charts Archived

And so we come to the end of another month, and for that matter, another year. I’ve just posted the 2014 chart (below) in the 2014 Water Level Charts album. This makes the third full year that I’ve been recording Clary Lake water levels. You’ll notice that last winter I stopped making water level measurements in early February and didn’t resume until April

1st due to cold weather, deep snow, and (for a while) ill health. I’ll keep measurements up as long as practical this winter but I imagine when winter really sets in that I’ll take a break and resume when weather permits.

12 waterlevelchart_December2014The December 2014 chart (at left) is interesting. The rainfall we received back on the 9th of the month and over the next few days, though only 1.78″ in total was enough to bring the lake level up fully 16″ and to within an inch of 2 feet below the top of the dam for a runoff multiplier of 9 x (1 inch of rain = 9 inch rise) due to partly melting snow but mostly just because the ground was frozen. In other words, little if any rainfall soaked into the ground. It all ran off (the runoff multiplier during summer months is generally more like 4 x). Subsequent additional rainfall brought the lake level to 22″ below the top of the dam, right about where it would be this time of year if the Water Level Order being adhered to.

I’d also like to take this opportunity to wish everyone a safe and happy New Year’s Eve and a happy and productive New Year. I sincerely hope that 2015 sees the Clary Lake water level order implemented, the lake level restored, and a satisfactory resolution of all the issues surrounding the Clary Lake dam, for all parties. The Clary Lake Association is diligently working to bring these things about. With your help, we will succeed.

November 2014 water level chart archived

11 waterlevelchart_November2014

November 2014

And so we come to the end of another month. You’ll find the November 2014 water level chart in the 2014 Water Level Charts Album. The lake level stayed in a fairly tight range for the entire month, right around -50″ below the top of the dam, give or take a few inches. It got as high as -48″ at one point and low as -52″ below the top of the dam. With only 2.66″ of precipitation for the month (average is 4.36″) you’d have expected the lake level to have fallen more. However, the ground is fairly well saturated from heavy October rainfall so most of the precipitation we received ran off into the lake. Also, the lake only falls about 1/2 inch per day when it’s at this level so it doesn’t take much precipitation to keep the lake level constant.

And that’s the way it looks from here.

11 November 2014: DEP issues Lake Elevation Survey

The Department of Environmental Protection has released an Elevation Survey for Clary Lake dated October 28th conducted by CES, Inc. , a consulting engineering and surveying firm with offices in various cities around Maine. The field work for the survey was conducted in the vicinity of the State boat launch on October 14th and refers to engineering work completed back in 2002 during the construction of the boat launch. The elevations on the survey are referenced to the NAVD88 elevation datum and are based on GPS measurements.

Special Condition 4 of the Clary Lake water level order required the dam owner to retain the services of a licensed professional land surveyor to establish the historical normal high water line of Clary lake. This survey was to have been completed and submitted to the Department by June 2nd of this year. Since the dam owner failed to complete the work as required, the Department of Environmental Protection has done so. This is a welcome development.

The survey concludes that the crest of the dam has an elevation of 151.17′ (NAVD88) and that the highest observed stain line on a rock in the vicinity of the boat launch has an elevation of 151.2′ (NAVD88). Thus, the survey has concluded that the historical normal high water line of Clary Lake is the same elevation as the top of the dam.

October 2014 water level chart archived

10 waterlevelchart_October2014I’ve archived the October 2014 water level chart. The lake started the month down about as low as it can get, around 60″ below the top of the dam. It has only been that low 4 other times in the past 3 years. This condition was the result of having received less than average rainfall in August and almost no rain (<1″) in September. While August and September were both short on rainfall, so far this year we’ve received a total of 39.40″ of precipitation, almost an inch more than normal.

03 October 2014: The lake is about as low as it’s going to get

The other day I posted the September Water Level Chart and I speculated at that time that I thought the lake was about as low as it is going to get. Tim Harkins had related how he’d tried to get into the channel and couldn’t find it. Well today I headed out in my kayak to the northwest end of the lake to try to find my way into the channel. I couldn’t. I could see where the water was flowing, but I ran aground in about 3″ of water trying to follow it. I didn’t push it because I didn’t want to get stuck.

The rate at which the lake level has been falling has been dropping off rapidly and as the following plot shows, it has about hit bottom:

water_fall_rate_plot1

Plot of water level versus day number.

The chart shows 36 days of falling water levels starting on August 16th and extending through today. Now I’m not saying the lake can’t fall any lower, but from the looks of that curve it is unlikely. Theoretically it could drop another couple of inches if we continue without receiving any rain, but that is unlikely. Without any rain, springs and water seeping out of the water table is sufficient flow to offset the 1/8″ per day the lake is falling.

What it interesting is that back in April 2012 the lake level fell to 62.25″ below the top of the dam, 2″ lower than it is now. It is hard to imagine the lake falling that low again. I suspect the sediment “dam” blocking the channel is the result of ice pushing against the lake bottom.

01 October 2014: September water level chart archived

9 waterlevelchart_september2014I’ve just archived the September 2014 water level chart… and what a month it was. The effect of only having received 0.95″ of rain for the whole month (average is 3.74″) is painfully evident in the slowly but steadily declining water level over the course of the month. The water level is currently 60.24″ below the top of the dam. It can fall further, but not a whole lot further: an examination of the data used to create the chart shows that the rate at which the lake is falling is dropping off fairly quickly. At the beginning of the month it was falling between almost 3/4″ per day. Now, at the end of the month, it is falling about 1/4″ per day. At that rate, it won’t take much rain at all to offset the drop and the lake will bottom out, and stop falling. Last Friday Tim Harkins told me that he’d tried to get up into the meadow in his kayak but was unable to find the channel.

The likely explanation for the situation Tim encountered is that low water conditions combined with ice over the past couple of winters have caused the bottom sediments in the vicinity of the outlet to be pushed up forming a bar of sediment and that this bar is blocking the outlet channel, impeding the flow of water out of the lake and limiting how low the lake get get. This same mechanism- ice pushing against the lake bottom over time- is likely what created the sand bar that can be seen down by the State boat launch. In that case, there was enough water flowing into the lake to cut a channel through the sand bar. It remains to be seen if there’s enough water flowing out of the lake to do the same thing. I doubt it.

Two years ago the lake got down to 63.25″ below the top of the dam. Realistically I don’t think it can fall that low again, but I might be wrong. In any case I intend to go out and try to find the channel myself, later this week. Stay tuned.

10 September 2014: Updated Bathymetric Chart available

Clary_Lake_Depth_Map_with_aerial_SMALLI’ve updated the recently released bathymetric chart with new contours using some additional data in the vicinity of the ledges at the northwest end of the lake and a few other rocks. The revised contour map now clearly shows both those ledges and the rock currently marked by a white buoy in the vicinity of the Whitefield/Jefferson town line near the north shore. Also, the 148′ and 146′ contours have been replaced with 1′ depth contours making this version of the chart more accurate in depicting the shallow water around the shoreline. I will, as time permits, further refine the underlying data.

If you’re not seeing version 0.2 dated 09/10/2014 (check lower left hand corner) try clearing your browser’s image cache.

Several people asked about getting a contour map superimposed on an aerial photograph. No problem! There are now two images available, a large scale one and a smaller more manageable image (click on the thumbnail at upper left). They’re also available on the Maps, Charts, and Graphs page. You’ll also find a .KMZ file there which you can load into Google Earth.

06 September 2014: New Clary Lake contour map finally available

Clary_Lake_Depth_MapI have finally gotten around to generating a contour map of Clary Lake using data collected by the Department of Environmental Protection during their September 2012 bathymetric survey. In addition to the high resolution image pictured at left there’s a smaller version available, and a 24″x36″ PDF which is quite large but which can be viewed or printed out at about any scale you wish. Feel free to download them, you’ll find them and the other files pertaining to the original bathymetric survey over on the Maps, Charts, and Graphs gallery. Each image has a link in the description field to the full-sized image.

The data set consists of 3,265 points with each point defining a 3-dimensional location on the face of the earth (i.e., the latitude, longitude, and water depth below the top of the dam). The depth was measured with a depth meter and each depth measurement was paired with the latitude and longitude of the point obtained via GPS receiver. The data in the form of a spread sheet was supplied to us back in April 2013 along with a colorized bathymetric map of the lake generated from the data. This map was a marked improvement over the original depth map of Clary Lake, prepared by the Department of Inland Fisheries & Wildlife back in late 1940s, but it lacks some real utility because it doesn’t show you what the bottom of the lake actually looks like- where the hills are, where the holes are, what the depth is at any given spot. According to the original depth map, the deepest spot in Clary Lake was only 23′ whereas we now know that the deepest spot is actually 29′ below the top of the dam. Continue reading

01 September 2014: August water level chart archived

8 waterlevelchart_August2014We’ve come to the end of another month, and I’ve archived the August water level chart. Despite the slightly less than average amount of rainfall in August (3.05″) and in spite of the fact that the dam’s gate has been wide open the whole time, the lake level remained in a fairly tight range of about ± 5″ for the month, starting out at a hair over 40″ below the top of the dam and ending the month a hair under 50″ below the top of the dam. In this range of water levels the lake tends to drop about 0.66″ per day, with the gate wide open. It doesn’t take much rain to bring the lake up a significant amount.

It is now just one month until October 1st, the date when the Clary Lake water level order is supposed to have been fully implemented. Given that Kelley has done absolutely nothing to implement the Order, it will be interesting to see what the DEP does when that date rolls around.

26 August 2014: Mapping DEP’s Bathymetric Data

In preparation for conducting a Water Level Survey sometime later this fall, I’ve put together an interactive map of the DEP’s bathymetric survey data using Google’s “Fusion Tables.” Each data point includes the latitude, longitude, and water depth in feet below the top of the dam. The data set consists of 3271 points, 6 of which I plugged in using data collected during our water monitoring activities. You can easily spot those as they fall in between the boat data tracks.

The deepest spot in the lake is about 28′ below the top of the dam. If your browser is failing to render the embedded map above, here’s a link to it:

Bathymetric Survey Fusion Table

The DEP conducted the field work in September 2012 and issued a colorized bathymetric survey the following spring. Eventually I will generate an actual contour map and also collect some additional data locating the rocks and ledges.

01 May 2014: April Water Level Chart archived

3 waterlevelchart_April2014April brought the highest water levels we’ve seen in 3 years due in large part to melting snow and high runoff as a result of frozen ground though we ended the month with only 2.77″ of rain, well below the average about 4.39″.  The water level started out around -40″ below the top of the dam on the 1st of the month and got as high as -18.6″ below the top of the dam on April 17th. It has been falling since then and ended the month at -29.3″. The dam’s gate has been wide open all month.

The deadline for submitting the Water Level Management Plan called for in the Water Level Order was today. We can only assume Mr. Kelley met the deadline. Stay tuned.

18 January 2014: Outflows from Clary Lake exceed 50 CFS

With the lake level higher than it’s been in several years, it follows that outflows from the lake should also be at levels not seen for quite some time. Well I had occasion to measure the outflow from Clary Lake this morning, out of curiosity as much as anything and sure enough, based on my calculations the current outflows as of the time of this writing are on the order of 83 cfs (cubic feet per second). The raw figure I arrived at was 98 cfs but it is customary to scale that figure down by as much as 15% to allow for flow losses resulting from friction on the sides and bottom of the stream which inevitably result in uneven water velocity and a lower overall flow value.

I estimate that about 55 cfs of water is flowing out of the dam’s outlet pipe and the rest of the water, about 30 cfs, is the result of water leaking through the hole in the dam and from seams on either side of the outlet. That there is a substantial amount of water leaking through the hole and cracks is apparent just by standing on the side of the road and looking at the downstream face of the dam. Here’s a short video I took this morning. What you can’t see in this video is the water leaking through the dam on the left side. It it essentially leaking across the entire face of the dam: Continue reading

14 January 2014: Lake level continues to rise

dam_14january2014Too bad it’s winter time and not boating time! The 2.3″ of rain we have received over the last 9 days has brought the lake level up over 23″ to -29″ below the top of the dam and it’s still raining. The lake has risen every day for the last 9 days and is now higher than it’s been since mid-June 2012. This makes for a runoff multiplier of 10x or 10″ of lake level rise for each inch of rain received. I attribute most of this to the time of year: with the ground frozen, less water soaks in and more runs off.

Lake levels normally fall during the winter due to a lack of precipitation but that’s not a problem this winter. I took the picture at left this morning when the surface of the lake was a little more than 30″ below the top of the dam, which is about 2″ above the water level at the dam. You can see water is now flowing out of the hole in the dam to the left of the outlet gate, indicating that the lake level has risen above the hole which is about -34″ below the top of the dam.

10 January 2014: Lake water level rises 13.7″ from last rain storm

The rain storm back on the 5th and 6th of this month dropped 1.37″ of rain on us. That rain has brought the lake up a total of 13.7″  for a runoff multiplier of 10x meaning that 1″ of rain brought the lake up 10″. This is impressive; normally the runoff multiplier is around 4x meaning an inch of rain brings the lake up 4″ but there is more runoff this time of year because the ground is frozen and little if any runoff soaks into the ground. The shape of the lake has something to do with it too: sometimes runoff causes the lake to get deeper, sometimes it causes it to get bigger, and sometimes it results in both happening at the same time. We’ve been in the “get deeper” range. Next up is the “get bigger” range where an inch of rain might only bring the lake up 2 or 3 inches but the size of the lake will increase substantially.

The lake level is now -39.2″ below the top of the dam or only 5.2″ above the hole in the dam. The lake is set to rise again fro the 1″ to 2″ of rain forecast for this weekend though I don’t think we’ll see a runoff multiplier of 10x, more likely 5x. That will bring the lake up to and likely above the hole in the dam which at last check was around -34″ below the top of the dam.

The thumbnail at left is a bit of a misnomer since the water level is a long ways from being “high” in my opinion. However Paul Kelley might have a conniption fit next time he stops by to check the Water Level Charts. The higher the better I say.


01 January 2014: Happy New Year & Water Level Year End Summary

13 waterlevelchart_2013Happy New Year everyone! It is the beginning of another year and I’ve posted the 2013 water level chart (at left) to the Archived 2013 Water Level Charts page. For some reason I can’t fathom (pun intended) the water level charts are not the most popular items on the web site, in fact only 2 people check them out with any regularity, David Hodsdon and Paul Kelley. David’s interest stems from having a scientific bent to begin with coupled with having measured the water level of Clary Lake off and on for the better part 30 years, and he just likes to admire a pretty chart. I suppose Paul has his own reasons for paying such close attention to the lake level. Perhaps he too just enjoys a pretty chart.

Initially I started measuring the water level of the lake to document the water level fluctuation and assess it’s impact on the environs of Clary Lake, to be used as evidence in support of our petition initiative. As with David, I also happen to have a scientific inclination as well as the technical skills and professional experience required so it has also served as a form of entertainment.  Call me crazy. Since starting measuring the lake level however, it has become more of a ritual, something that I do with a measure of solemnity though it’s challenging to keep it up on a regular schedule during the winter due to the complications of snow and ice. It remains to be seen if I will continue with the practice once the Water Level Order goes into effect and water level measurements are being made at the dam; I expect I will at least initially because I want to investigate further the dynamics of runoff, water flow, and their effect on the elevation difference between the lake surface and the water level at the dam.

Some 2013 Statistics:
There are lots of ways to slice and dice the volume of data I’ve collected. Here are a few statistics for the past year. If anyone is interested in the raw data, just ask.

  • We started the year at -48.36″ below the top of the dam and ended slightly lower at -51.48″ below the top of the dam.
  • We received 40.23″ of precipitation in 2013 compared to 39.98″ for 2012, only 1/4″ difference.
  • The highest water level we saw in 2013 was -31″ on May 30th and the lowest was recorded on January 29th when it reached -61.68″ below the top of the dam. For comparison, in 2012 the highest was -19.08″ on June 7th and the lowest was -62.52″ on April 21th.
  • The average water level in 2013 was -48.9″ below the top of the dam compared to -45.7″ below the top of the dam in 2012.
  • In 2013, the dam’s gate was closed for only 10 days, from May 17th to May 26th during which time we received 4.33″ of rain which brought the lake up 25.56″ to -31″ below the top of the dam by May 30th, the highest the lake would get in 2013.
  • In 2013 the depth of water over the foot of the State boat launch was equal to or greater than the design value of 2.3′ for only 7 days during the last week of May.

Archived 2013 Water Level Charts

21 December 2013: Thoughts on the DRAFT Clary Lake water level order

finish-line-ahead
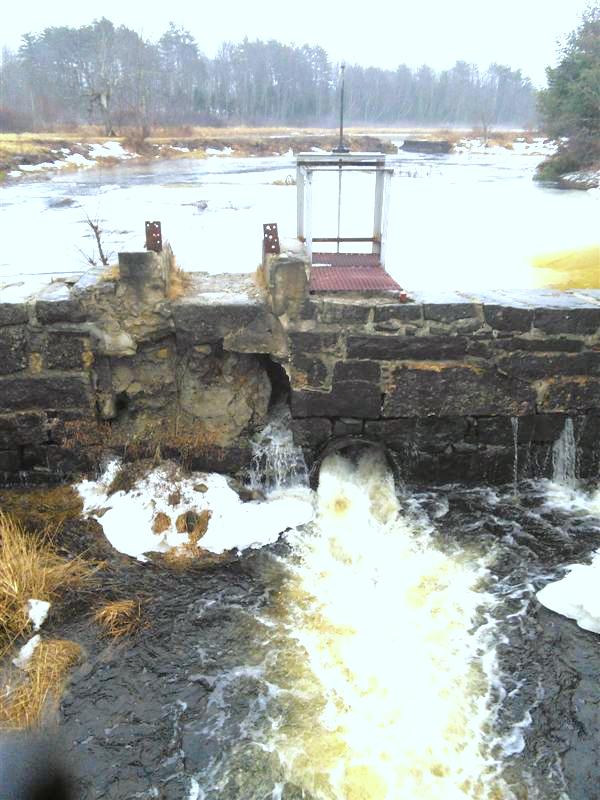
A number of people have asked me for to explain the DRAFT Clary Lake water level order that was issued the other day. It is a very detailed and complex document with many subtle (and some not-so-subtle) elements and there is certainly a lot to ponder. I have reviewed it at length and will state for the record that I think the water level order is FANTASTIC. It is essentially what we asked for, and it was worth waiting for.  I have begun preparing comments on behalf of the Petitioners to submit to the Department and which are due on or before December 30th, so I’m not going to go into a lot of detail now. I will however go over the highlights.  I encourage everyone to read the actual
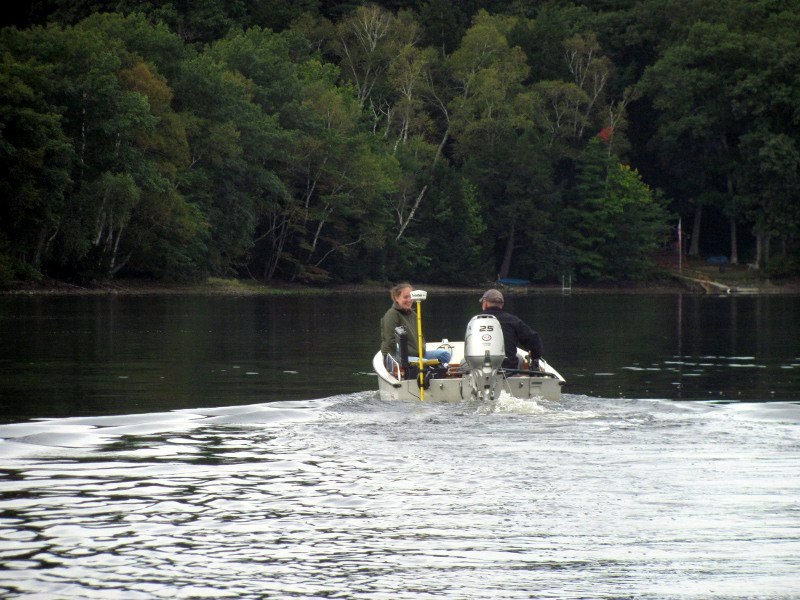
 ORDER and if you have any questions or comments, please send them to me.

The first 11 pages of the draft order constitute a Findings of Fact and a review of the evidence that the Department considered in making their decision. It is totally worth reading, especially C. “TITLE, RIGHT, OR INTEREST” on page 6 of 16. The WATER LEVEL ORDER proper starts on page 11. The major elements of the order are as follows: Continue reading