
 The past couple of months have been busier than usual for me and I completely forgot to post the August 2025 monthly water level chart, the first time I can remember missing a month. Now here it is the middle of October and I have yet to post about the September water level chart. Well I have archived both the August AND the September water level charts (August above, September at left).
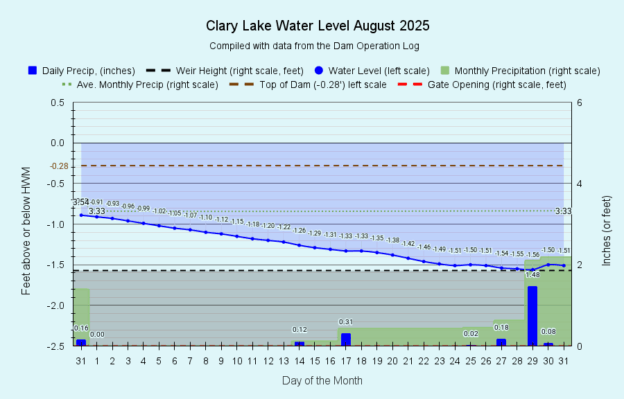
We only need one word to describe August 2025: DRY. We didn’t receive a drop of rain during the first 13 days of the month and didn’t get a soaking rain until August 29th when we received 1.49 inches of rain in one overnight event. For the month we received only 2.19 inches of rain, well shy of the normal 3.33 inches. The lack of rain contributed to a significant loss in lake level over the month. We started at -0.91 feet below the HWM and ended the month at -1.51 feet or 18 inches below the HWM, our normal fall target level. I’ve been figuring that 2/3 of our water loss was due to evaporation with 1/3 due to leaks but now that fall is here I figure evaporation accounts for about 1/3 to 1/2 the water loss with leakage making up the remainder.
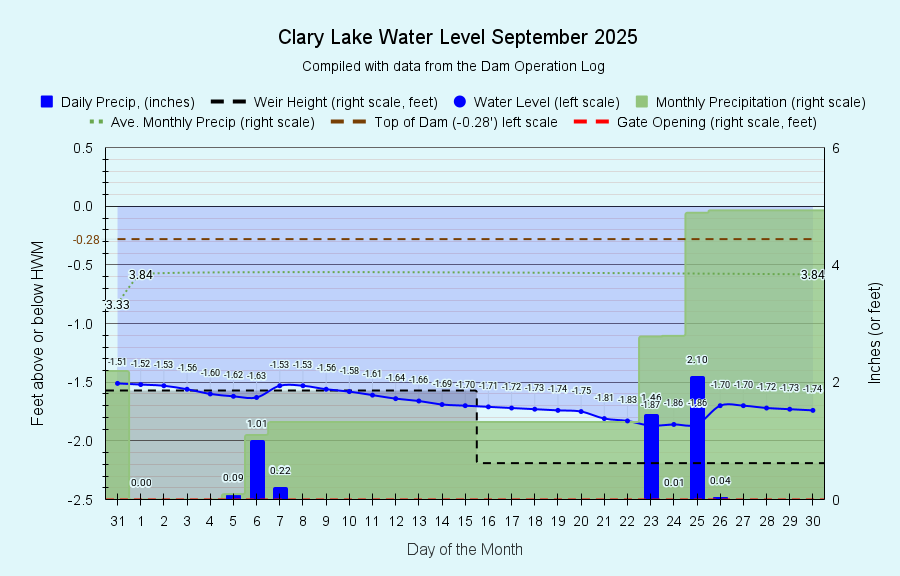
September was a pretty dry month too at least until the last week of the month when a couple of back to back rainstorms brought us up to 4.93 inches for the month, a good inch more than normal. However, the rainfall wasn’t enough to break the drought which still plagues the State today.
September also saw a significant algal bloom this fall. It was expected, it did not come as a surprise- summer water conditions and the phosphorus samples we took all suggested a bloom was likely in the fall when the lake turned over. We were not wrong. By the end of September lake transparency had dropped to less than 2 meters. As of the time of this writing, it has largely cleared up. Here are a couple of pictures I took in early October:

