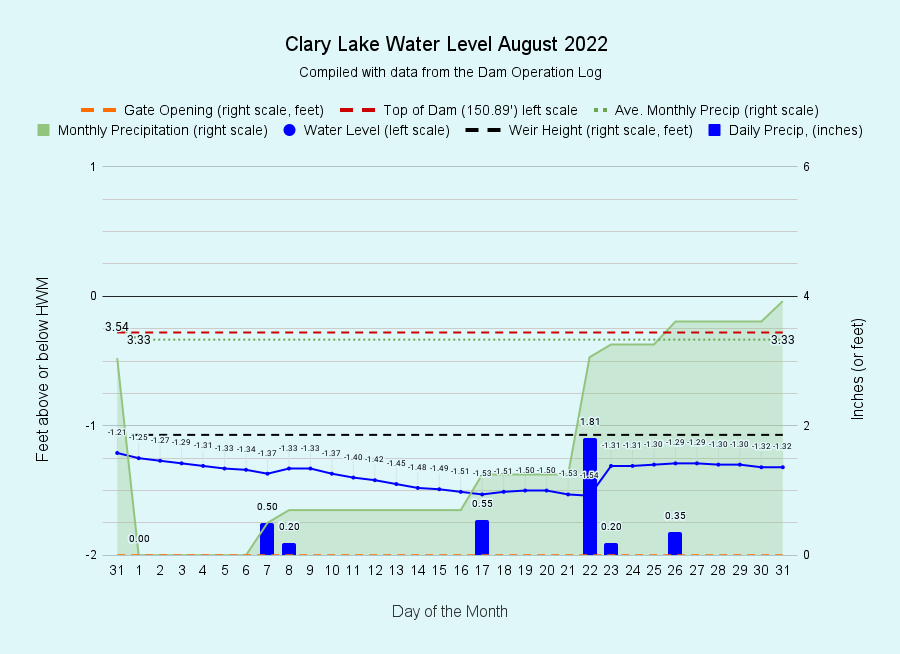
 I have archived the August 2022 Water Level Chart (at left). In August we finally got a reprieve from the drought conditions that have plagued us for the last 4 months. For the first time since April we received more than the average amount of monthly rainfall. All told, we received 3.93″ of rain, 0.6″ more than average. Drought.gov now shows us to be in Moderate Drought which is less droughty than previously, suggesting that ground water supplies are improving but are still somewhat depleted. My own rainfall records show us 0.90″ ahead for this date but that doesn’t speak to groundwater supplies.
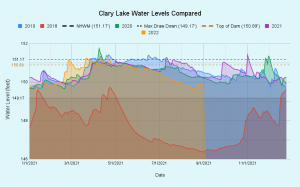
 As one would expect, all this rain had a beneficial effect on the lake level which has been rather low compared to recent years (see chart at left). The lake fell steadily from the start of the month from -1.21 feet below the NHWM to a low of -1.54 feet on August 22nd; then it jumped up to -1.31 feet in response to a significant rainfall and has more or less stayed there, relatively stable, around -1.32 feet for the last week of the month. It’s still lower than usual for this date, but it’s not as bad as it would have been if we hadn’t received normal rainfall in August. It is also too soon to tell whether we’re shifting to a more normal rainfall pattern or not. As you can see from the last week of August, it won’t take much rain to offset the minor losses through leakage and evaporation and keep the lake about this level going into fall. Minimum flows rise to 3.5 cfs on September 16th, but at this point, we’ll need to see more inflows to justify increasing outflows.
