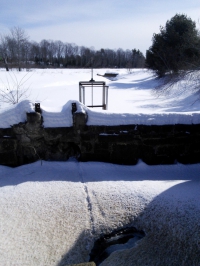
Well, not really. I did go over to the dam today and took the picture at left showing some open water between the railroad bridge abutments. By carefully measuring the image using known distances for the length of the southerly abutment (~23′) and the distance between the abutments on the west end (~17′) and after adjusting for the skew angle (simple trigonometry) I came up with a water level value of approximately -48″ below the top of the dam (which is probably within ±3″ of the true value). This value is consistent with the amount of water I observed flowing out of the dam, which wasn’t a whole lot. It is also within a couple of inches of where the lake level was at the end of January when I halted water level measurements. I think the lake level has been fairly stable: while there wasn’t a lot of runoff last month, there’s a lot of snow piled up on the lake and that’s almost the same thing.
At the end of the description of the above picture there’s a link to a full sized version (or click here) on which you can easily see dark stain on the abutment representing the approximate normal high water line, about 1′ below the top of the abutment.
 I also added a chart for February 2015 (using precipitation data from the Weather Underground) to the 2015 archive more or less for a place holder since there really isn’t much to look at on it, and I updated the Current Water Level Charts page with a rudimentary chart for March. I’ll try and get an approximate water level more or less weekly until conditions allow me to resume regular measurements. I expect when our awesome 48″ snow pack melts we’re going to see a substantial rise in the lake level.
While I was at it, I corrected the mislabeled January 2015 water level chart which unfortunately claimed to be for December 2014. Nobody noticed, or else nobody bothered to point it out to me.
Think spring!

