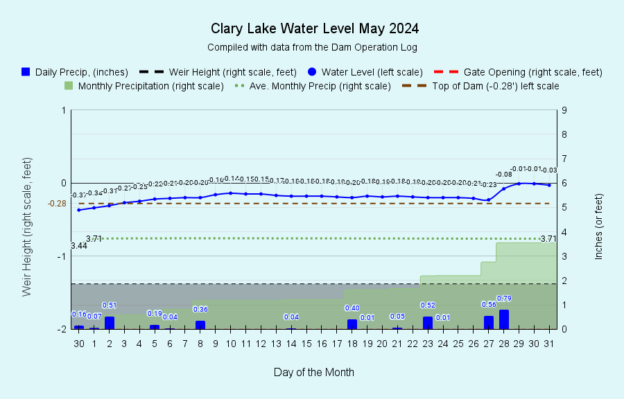
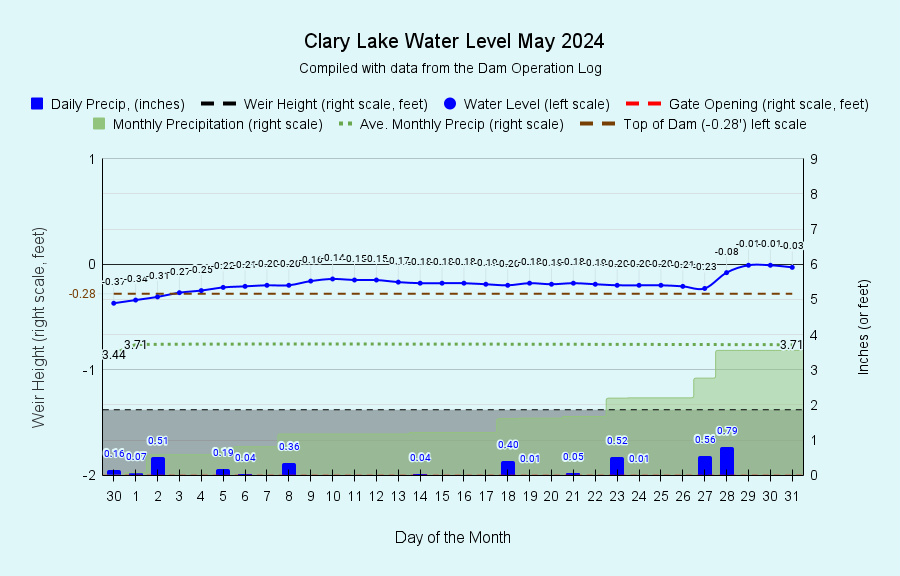
 I have archived the May 2024 water level chart (above, and at left). May’s rainfall was more or less normal for a change, we received 3.55 inches of rain, only 0.16 inches less than the normal 3.71 inches. This allowed things to dry out a bit and resulted in a very stable water level right around or slightly above the top of the dam for most of the month. The biggest rain storm of the month occurred on the 27th and 28th of May, dropping a total of 1.35 inches of rain and gently pushing the lake level to just 0.01 feet shy of the “official” HWM elevation (established by DEP back in 2014) of 151.17 feet. I consider the “practical” HWM to actually be 0.22 feet lower, at 150.95 feet (which we’ve adopted from the USGS National Map, see below) which is effectively at the top of the dam; at that elevation, there’s just a wee bit of water dribbling over the dam in a couple of spots, as you can see in this chart from May 5th when the water level was at 150.95 feet:
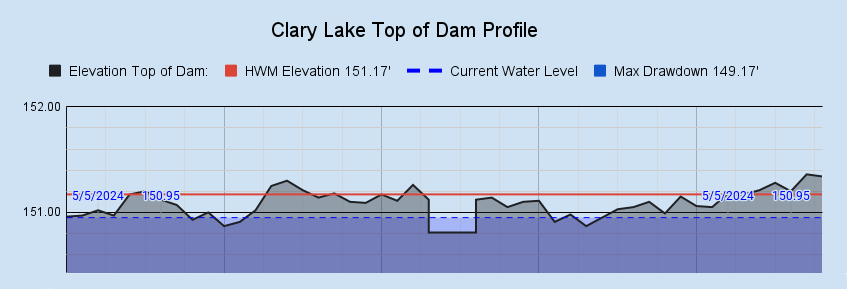
We can actually maintain the lake at this level, or at least try to, whereas maintaining the lake level at the “official” high water mark of 151.17 feet is impossible, for the obvious reason. For what it’s worth, our “unofficial” elevation of 150.95 feet also happens to be the exact elevation given for Clary Lake on the USGS National Map as you can see in this screen shot:
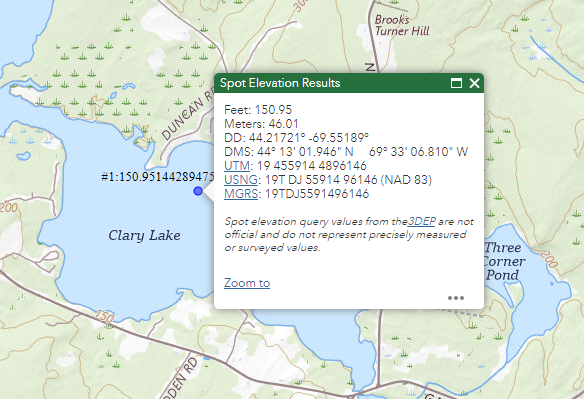 The USGS undoubtedly came up with 159.95 feet using LIDAR data of the top of the dam. It is remarkably close to the average height of the dam. Unfortunately, as much as I’d like to formally adopt the USGS value as the practical HWM elevation, we’re stuck with the “official” HWM DEP came up with because it is part of our fully adjudicated Water Level Order and only an act of God can change that. Unofficially, we use 150.95 feet as our water level target and consider the lake to be over-full when the lake is at the official HWM of 151.17 feet, a condition that is self-correcting.
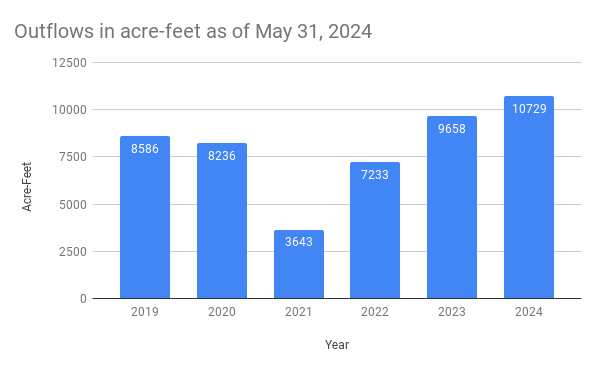 Lake outflows to date continue to exceed outflows of previous years going back to 2019, when records start. It still isn’t clear whether high flows help or hurt lake water quality. Flows are not the whole story however, they’re merely one (big) piece of the water quality puzzle that we’re trying to put together. Possibly the worst year for algal blooms was 2022 when we were in drought from May through August and into September during which time outflows were almost non-existent and the lake level fell to -1.6 feet mostly as a result of evaporation. We had a severe algal bloom that lasted from the first of September until late November. Flows for the year ended up about average with a flushing rate of 1.85X and a retention time of 197 days.
The single biggest piece of the water quality puzzle of course is Phosphorus. We’ve been taking 3 water samples for Total Phosphorus per season, starting in July. The CLA Board has voted to increase the number of water samples per season from 3 to 4. We’ll now be starting in June. This will provide us with a more detailed profile of Phosphorus in Clary Lake. Kelsie French and I are heading out to the deep hole later today for our biweekly (every 2 weeks) water quality monitoring session and we may collect a water sample for TP testing today, if it appears the lake has stratified sufficiently to make it worthwhile. For more information about how and why we monitor Phosphorus, see Total Phosphorus In Clary Lake.