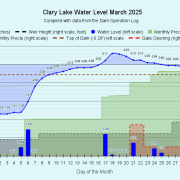
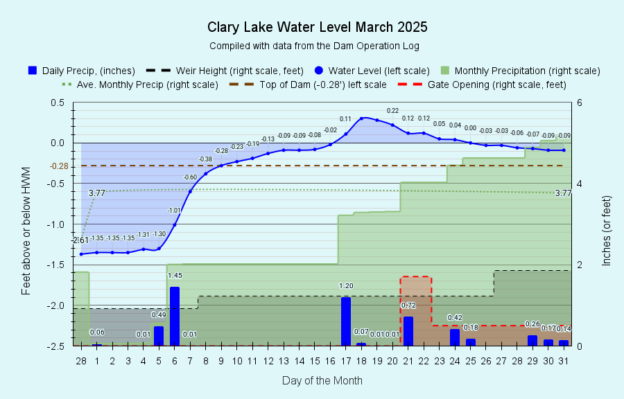
 I have archived the March 2025 water level chart (above, and at left). The drought conditions in January and February finally gave way to increased precipitation in March which made up some, but not all of the precipitation shortfall so far this winter. All told we received 5.17 inches of water in March, 1.40 inches more than normal bringing us to 8.80 inches for the year or 87% of normal. The lack of precipitation this winter has resulted in lowered ground water supplies leading the Maine Drought Monitor to calling us “Abnormally Dry,” a somewhat unusual condition for this time of year. We took advantage of the increased precipitation in March to raise the lake level by gradually adding stoplogs to the weir. We started the month with the lake at -1.35 feet below the HWM, briefly peaked at 0.3 feet ABOVE the High Water Mark, and ended at -0.09 feet with a little water flowing over the top of the dam. The gate is currently open 1/2 a foot.
Keeping an Eye on Flows
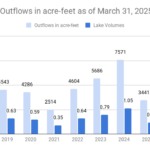
 The reduced groundwater supply has been evident in lake outflows this winter which have been considerably lower than normal as can be seen in the chart at left. During the winter and very early spring, only some of the water leaving the lake comes from runoff because much of the surface water is locked up in snow and ice. A good deal of ground water however seeps in to the lake to replace water lost downstream, leaving one sometimes wondering “Where’s all the water coming from?” This situation usually continues into Spring when spring melting starts and runoff increases significantly. Our Minimum flows regime anticipates this springtime situation with the highest annual flows of 35.9 cfs between March 16th and May 15th. Well not this year! For much of the winter outflows have been the lowest we’ve seen since recordkeeping started in 2019. Increased runoff in late March changed that situation somewhat, but outflows are still quite low compared to previous years, second only to the flows in 2021. On the whole, lack of inflows has prevented us from meeting our minimum flows requirement for much of the winter. See Minimum Flows Explained for more about this requirement.
Ice Out 2025
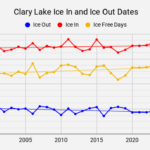
 The clearest evidence that we’ve actually survived another winter and that spring really is on the way and not just a vicious rumor is the annual ice out event, something I especially look forward to. Clearly, if the ice melts on Clary Lake, can summer be that far off? This year’s Ice took its time getting gone over a period of about a week and a half, finally clearing out on April 1st (see 2025 Ice Out Contest Finally Over!). This year’s ice out date fell on day 90 from the beginning of the year, just a hair above the ice out trend line as you can see from the chart at left. Though our data only goes back 24 years, a distinct warming trend is already evident. Ice in is trending later and ice out is trending earlier. The ice-free days trendline distinctly sloped because that statistic is picking up days at both ends. All told this winter we had 99 days where the lake was completely covered by ice.

