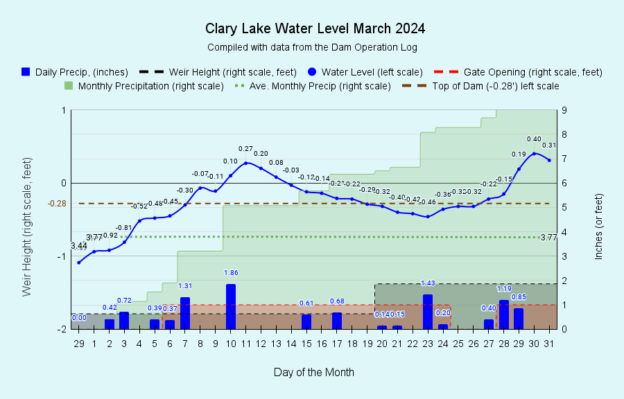
I have archived the March 2024 water level chart (above, and at left). The dearth of precipitation we saw in February did not continue into March. On the contrary, we ended up with 10.72 inches of precipitation making March 2024 the second wettest March on record, only slightly behind the 11.24 inches received in March 2010. “Normal” March precipitation in this area is around 3.77 inches but we received more than 2.8 times more than that. Even with the lack of rainfall we saw in February, we end the month with nearly 7 inches more annual precipitation than is normal for this date. March was also warmer and windier than usual which resulted in Clary’s ice cover melting off on March 8th, the earliest we’ve recorded since record keeping started in 2001.
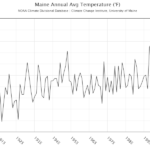
 Signs a warming climate are all around us. The most obvious aspect of climate change is rising temperatures. This chart at left is from the Maine Climate Office website and shows the Average Annual Temperature in Maine from 1895 through 2023 (the Annual Average Temperature Anomaly chart is another good one to ponder). It doesn’t require a PHD in climate science to see that the annual temperature trend over that period has been steadily rising. Rising temperatures mean shorter, milder winters and more ice-free days which translates into generally rising water temperatures. Warmer water may seem nice when you’re swimming in the summertime, but it brings with it a host of water quality issues including reduced oxygenation (warmer water holds less dissolved oxygen) and increased algae growth. For a variety of reasons, neither of these impacts is desirable from a water quality perspective.
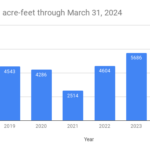
 All the rain we received in March meant outflows from Clary Lake were at record levels leading to a highly fluctuating water level as a quick look at the chart will show. The chart at left shows outflows from Clary Lake on March 31st for the past 6 years compared to 2024. Outflows on this date far exceed what we’ve seen in previous years. We’re still studying the impact high flows have on water quality.
We try to keep the lake level at or near the top of the dam in the early spring but twice in March, on the 10th and again on the 29th, rainfall resulted in the lake level rising well above the Normal High Water Mark elevation of 151.17 feet. This isn’t really a problem because the dam is designed to release excess water over the top, but as a matter of course we do try to keep the lake level around the top of the dam. Our goal in the spring is to gradually bring the lake level up and to that end we added 4 additional stop logs to the weir on the 19th. The final rain event that started on the 27th wasn’t initially supposed to amount to much so we closed the gate on the 24th to preserve water only to have the forecast change drastically a few days later necessitating we open the gate again.
Happy Spring!


