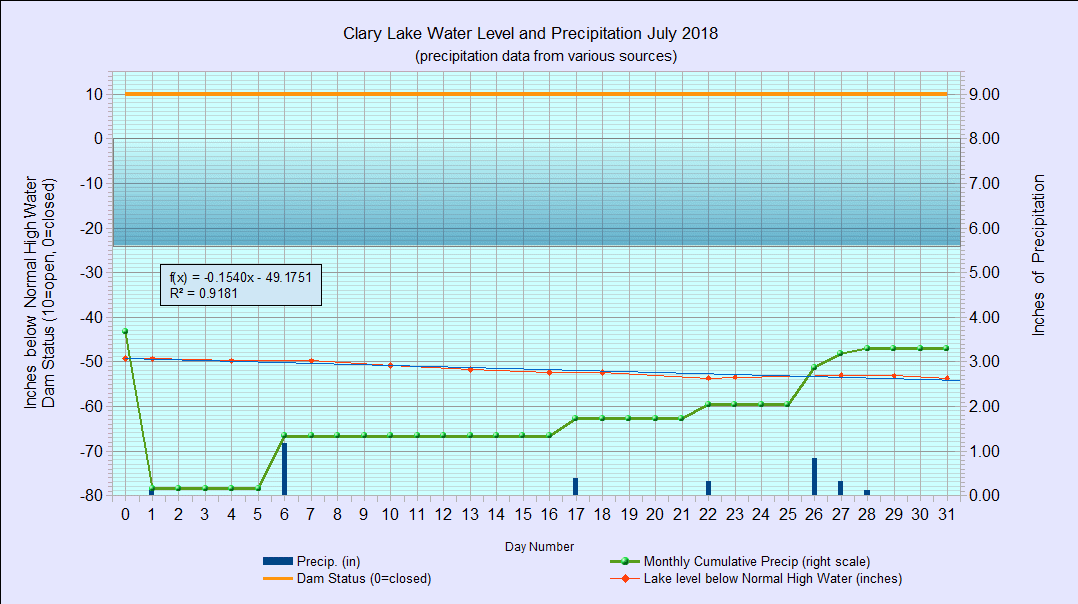
I have archived the July 2018 Water Level Chart (at left). The water level in July continued the steady decline seen in June though at a slightly reduced daily rate, falling only 4.32″ over the course of the month. An indication of how steady the decline was is the “coefficient of determination” (the R² or “R squared” value in the inset box on the chart) which in simple terms is a statistical measure of how close the data points fit a straight line. An R² value of 0.9181 means the data points collected over the month are very close to a straight line (a perfect fit would have an R² of 1.00). Because of the relative drought we’re experiencing, the 3.30″ of rain we received during the month had very little effect on the lake level, which only rose marginally for a few days towards the end of the month. We end the month about where we were this time last year, only 1.68″ lower than on July 31, 2017.
Average rainfall for July is 3.43″ so at 3.30″ we’re fractionally below normal for the month but at 19.67″ rainfall for the year to date, we’re 3.13″ below the average of 22.80″ for this date.
Since this post has taken on a decidedly statistical nature, I might as well introduce a couple of graphs I’ve made that model various characteristics of Clary Lake. Once I had completed an accurate depth map of Clary Lake in early 2016, I had all the pieces I needed to build a real bathymetric model of Clary Lake which in simple terms is a few formulas that can be used to calculate and compare various data about Clary Lake from a single water level measurement. The water level tells me the area and volume of the lake. Knowing that information, new data relationships can be examined. The data I have derived is Percent of Full, Area, Percent of Area Loss, and Volume Loss.
Here is the first chart (at left) that shows the rate of change in volume vs the rate of change in lake area, going back to June 2016. The left hand scale is the size of Clary Lake in acres and the right hand scale is percent volume. When the two lines coincide it means that the rate of change in area and volume are about the same. When the lines diverge however it means that one value is changing faster than the other. When the lake level falls, the size of the lake drops as well. When the lake is almost full, a drop in water level of 12″ reduces the area say X acres; when the lake is down at 65% of full, that same 12″ drop in lake level reduces the area only 1/2 X.
It’s a little difficult however to visualize change in percent of volume so to remedy that problem I produced a similar chart covering the same time period showing lake area vs lake level which is a easier to grasp than percent of lake volume. The left hand scale shows Surface Area (in acres) and the right hand scale shows Lake Level Below the Normal High Water Mark (in inches). Now you can easily see that these two data sets are not changing at the same rates. When the lake is at 10″ below the NHWM, the volume is at 700 acres; when the lake level falls 20″ to -30″ the area has dropped to about 575 acres for a change of about 125 acres (6.25 acres per inch of fall). When the lake drops an additional 30″ to -60″ below the NHWM, the area falls to about 450 acres (4 acres per inch of fall). When the lake drops only an additional 8″ from -60″ to -68″ the area drops only an additional 20 acres, from 450 acres down to about 430 acres (only 2.5 acres per inch of fall). Neat huh.
These charts can help you better visualize the shape of the lake. If the lake were a cylinder (like a glass of water or 5 gallon bucket) with straight sides and a flat bottom, a change in the level of water in the cylinder would not change the surface area of the water in it at all. If the lake were shaped like an upside down cone, the rate of change of area and volume would be constant regardless of the level of the water. The lake however is actually shaped more like a soup bowl: gently sloping around the edge, steeper sides when you get out a ways, and a (relatively) flat bottom.
So the lower the lake level gets, the slower it gets smaller. Got that?
You’re welcome 🙂


