Category Archives: Weather

31 October 2015: October 2015 Water Level Chart Archived

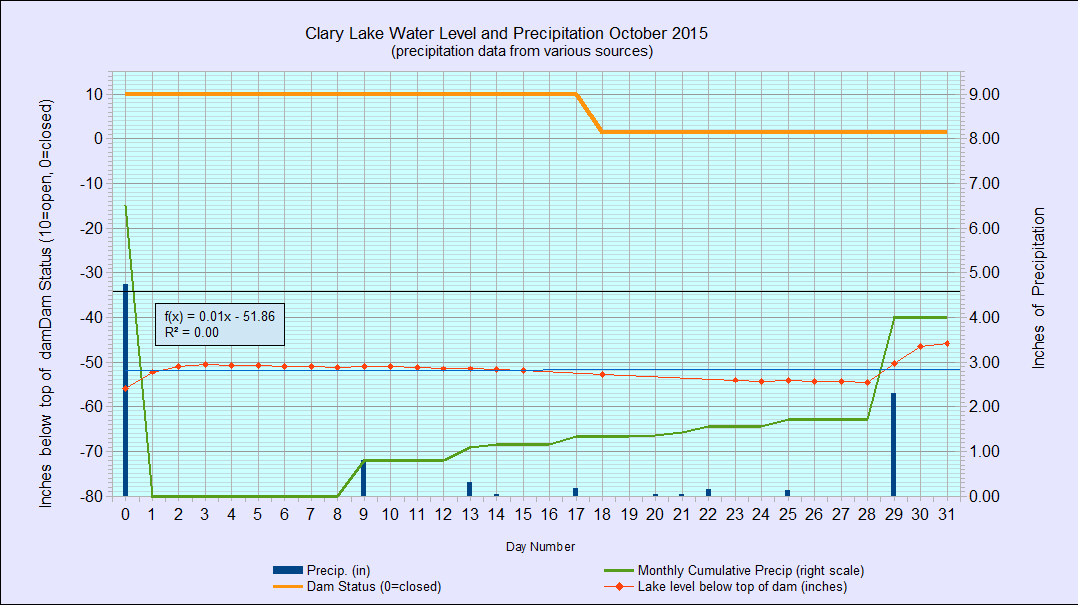
10 waterlevelchart_October2015[dropcap]I’ve[/dropcap] archived the October 2015 water level chart (at left). The most notable thing about it is that sometime during the weekend of October 17/18 the gate on the dam was almost completely closed. The gate had been wide open since October 13, 2012. The gate still remains open about 3″ or 4″ or so, presumably so as to provide the minimum outlet flows calculated for Clary Lake and required in the Clary Lake water level order (WLO). Regrettably, the gate opening still allowed too much water to be released as the lake level continued to fall albeit at a somewhat slower than usual rate: the lake level dropped 0.15′ (1.80″) over the next 10 days (0.18″ per day; normal for this water level would be 0.25″ per day) until the 29th when we received 2.3″ of rain in one intense 12 hour storm. That the lake continued to fall after the gate was lowered clearly indicates that outflows from the dam exceeded inflows into the lake by measurable amount, which means too much water was being released. In my copious spare time I’ve been working on a post about minimum flows but it’s not ready so I’m not going go into them now. Minimum flows are fully explained in the Department of Environmental Protection Rules, Chapter 587: IN-STREAM FLOWS AND LAKE AND POND WATER LEVELS. While that’s not an easy document to wade through, it makes for interesting reading and fully explains the the purpose of minimum flows.

[dropcap]At[/dropcap] 45.84″ below the top of the dam, the lake level is higher now than it’s been since May 21st of this year. As high it seems that is still more than 2′ lower than it should be this time of year (no more than 2′ below the top of the dam). The 2.3″ rainstorm on the 29th brought the lake level up 8.76″ for a runoff multiplier of 3.8x which is still a little low indicating that runoff is somewhat reduced because the ground is still relatively dry and a lot of the rain is soaking in rather than running off. Average yearly rainfall for our area is about 42″ and as of the end of October, we’ve received only 29.41″ or more than 12″ less than normal, and only 2 months to make up the difference. Unlikely.

[dropcap]I[/dropcap] hate taking my boat out and I usually put off hauling out in the fall as long as I can. I think however I will take advantage of this increased lake level and haul my boat out tomorrow.

30 October 2015: Grand Army Weather station back online

Tim Chase’s Grand Army Weather Station and Web Cam have been offline since sometime in 2013. Last month I helped Tim get his Web Cam  back up and running, and since then he’s been working at getting his new Grand Army Weather Station hardware set up, wired, and calibrated. Today we spent the afternoon working together and got his weather station updating his website again. We’ve got plans to give his site a face lift and add some additional functions and features later this winter. Stay tuned.

http://www.grandarmyweather.com/

The weather data is uploaded to the website every 30 minutes, 24 hours a day. It’s great to have a local weather station to refer to again, and I’ll probably use a some of the data on this site, and likely will start using the precipitation data on the Clary Lake water level charts


01 October 2015: End of September rain event impacts lake water quality

Over 4″ of rain fell in less than 24 hours on September 30, 2015 resulting in severe sedimentation of Clary Lake from shore erosion and stream scouring. This short video show the stream at the Jefferson/Whitefield town line on the south side of the lake. What isn’t really evident in the video is the plume of sediment washing out into the lake.

Needless to say, if the lake level were where it should be this time of year (between 1′ and 2′ below the top of the dam) this rain event would have had little impact on lake water quality.

24 September 2015: Grand Army Weather Station coming back online

IMG_20150924_091244Tim Chase’s Grand Army Weather Station website has been down for a few years. I’ve been helping him get it back up and running. Today we swapped in a new camera and got the Webcam working again. The picture at left shows Tim this morning up on the roof of his house at the top of Grand Army Hill. This new camera is much better than the original one. The view out over the Sheepscot River valley from up there is outstanding. I’ve added a Grand Army Weather Cam page on this site, because I can. You’ll find the link to it under the Pictures main menu heading (under the Clary Lake Webcam). Later this fall I’ll be helping Tim get his new weather station up and running online. Stay tuned!

01 September 2015: August 2015 water level chart archived

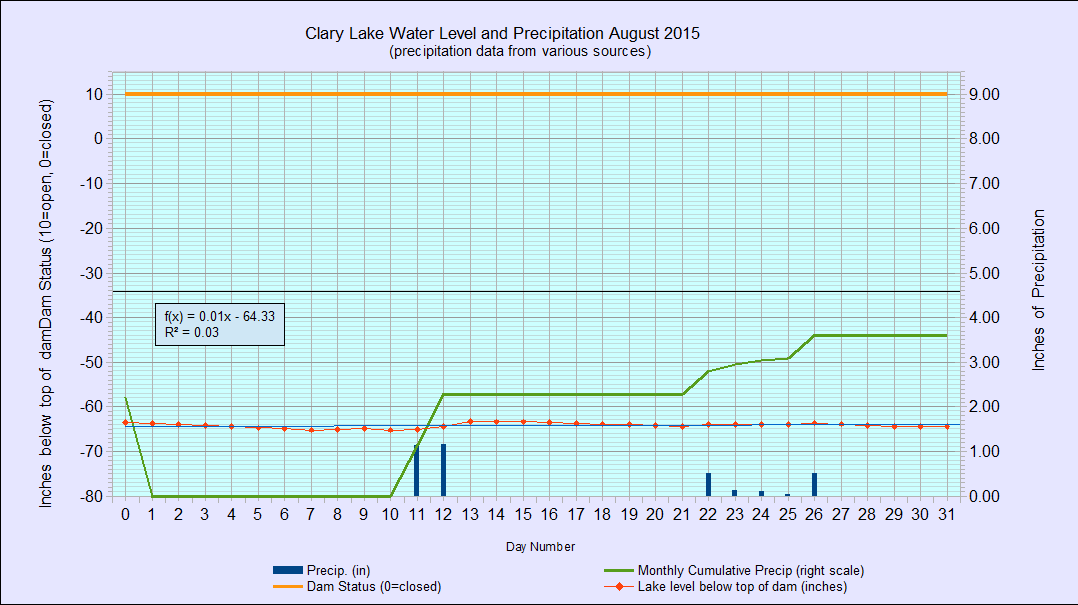
8 waterlevelchart_August2015I’ve archived the August 2015 water level chart (at left), and what a chart it is. One glance and you can see that the water level hardly moved. For the entire month the lake level never rose above -63″ below the top of the dam and on August 7th it reached -65.16″ below the top of the dam, the lowest level I’ve ever recorded. The lake is so low in fact that water is no longer flowing out of the lake into the outlet channel and hasn’t been since early July; there’s a trickle of water flowing through the open gate in the dam but it is coming from ground water and springs in the meadow area. It’s actually been at or below -60″ below the top of the dam since July 10th. This makes it the longest stretch of the lowest water levels we’ve experienced in the last 4 years. It’s gotten almost this low before, but it has never stayed this low for this long.

The low water condition has been exacerbated by the near-drought conditions we’ve experienced so far this year. As of the end of August we had received only 18.88″ of precipitation for the year compared to 32.83″ on this date a year ago. As a result, because the ground is so dry, there has been no absolutely no runoff as the result of what little rain we have received. To make matters worse, because of the topography of the shoreline around lake, when it does rain the lake doesn’t so much get deeper as it does bigger. This then explains how last August 11th and 12th when we received 2.29″ of rain, the lake only came up 1.92″ total. This defies logic, but as those of you who have stuck sticks in the mud on your water front to mark where the water line is can attest, it ain’t moved.

This extended period of excessively low water levels has severely restricted everyone’s use and enjoyment of Clary Lake even more than usual, not to mention the ongoing impact on wildlife habitat, and water quality. There will be consequences.

May 2015 water level chart archived

5 waterlevelchart_May2015

May 2015 Water Level Chart

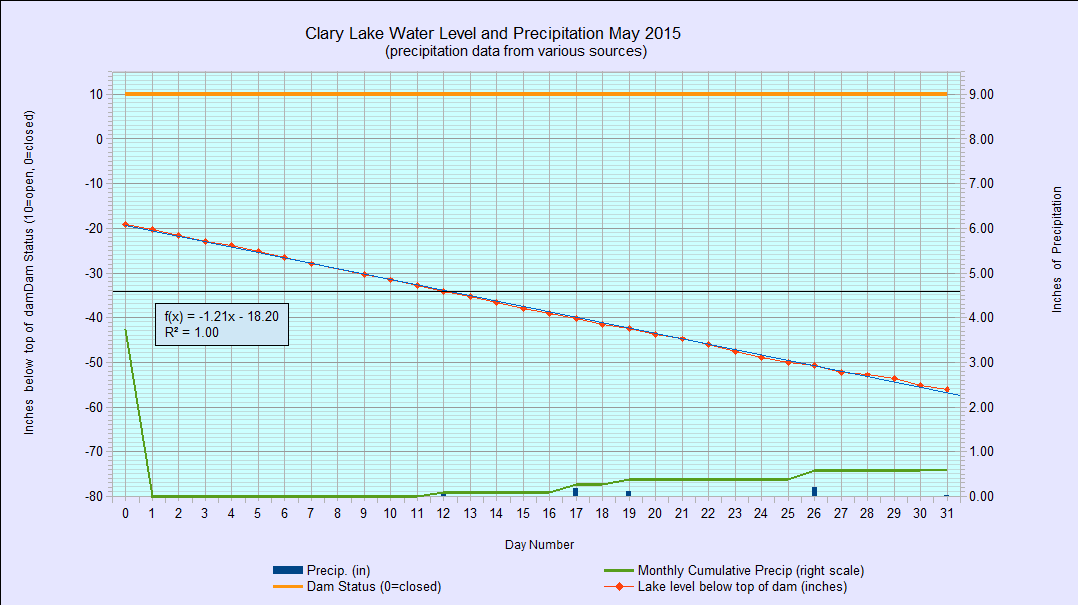
Behold the May 2015 water level chart. After rising to within 12″ of the top of the dam on 23 April, the lake has fallen steadily to about where it was before the spring melt started back on March 24th. At that time the lake level was at -57.12″ below the top of the dam. At -56.04″ we’re within an inch of that now.

For the month of May, the lake level dropped 35.76″ in 31 days, or about 1.15″ per day, a rate that was negatively affected by the lack of rain. Normally we get about 3.7″ of rain in May which would have offset the fall in the lake level considerably, however this year we received only 0.60″ of rain for the entire month. As a result, as a quick look at the chart will show, the lake level fell every day. Also, because it was so dry, evaporation contributed significantly to the daily water level drop. Since the high on April 23rd, the lake level has fallen 43.32″ in 39 days or 1.11″ per day. Normally you would expect the rate of fall to slow gradually as the level dropped. Below 48″ the usual rate of fall is about 1/2″ per day.

We can all take comfort in knowing that this ongoing ecological disaster won’t be ongoing forever. It will be a little while longer, but normal water levels WILL BE RESTORED.

Time Lapse Video of Clary Lake Ice Out, Spring 2015 [UPDATED]

Over the last 4-5 days there has been a LOT of traffic to the web cam page, people have apparently been anxiously following the progress of the ice going out. I sure have been. Here is a time lapse video showing the ice going out over the last 3 days, compressed into 92 seconds:

The video is comprised of the same photographs you see on the web cam page which are posted to the site every 2 minutes. I’ve removed the night time shots to keep the file size small. Most of the ice-out action happens on the 3rd day (April 18th). If you’re paying attention you’ll spot a muskrat swimming back and forth a few times and a few birds popping in and out of the scene.

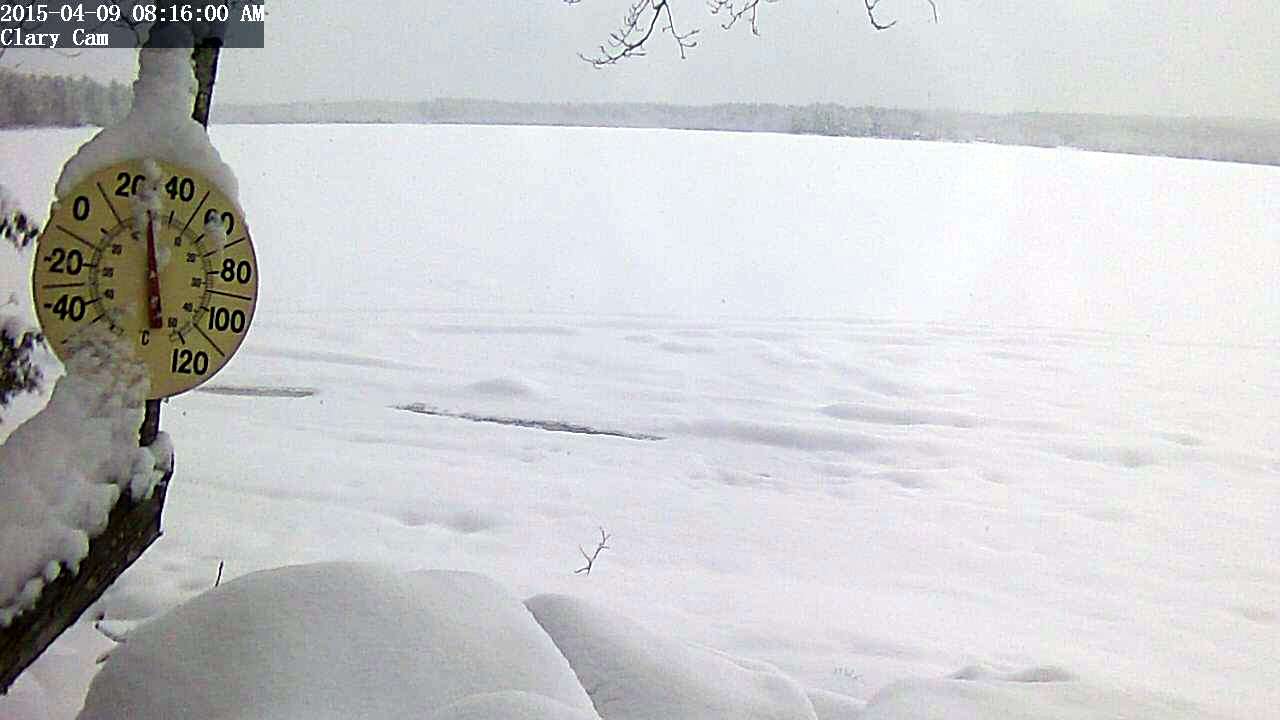
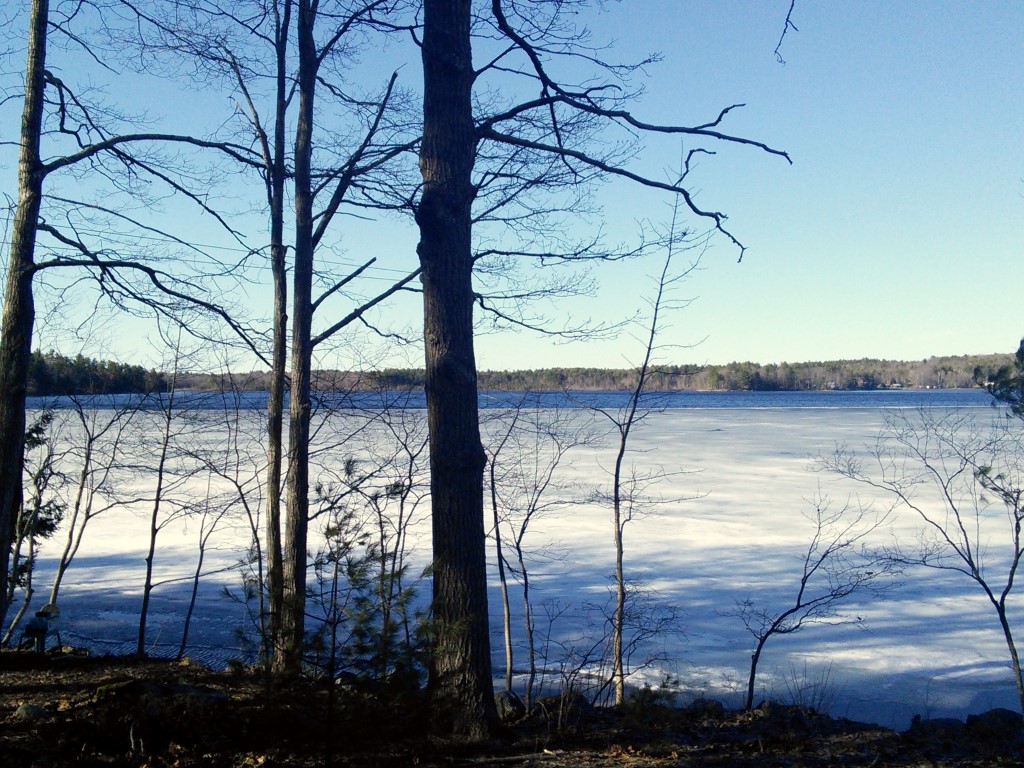
Nobody is more surprised at how fast the ice went out this year than I am. On April 9th the lake was solidly frozen over with 6″ of new snow on it. Today, 9 days later… and there is just a little ice left hanging onto the edges in a few place. The ice isn’t officially out until David Hodsdon says it’s officially out. I’ll post the official date on the Ice-In and Ice-Out Dates page when David gives it to me.

IMG_20150419_075002.jpg[UPDATE: 19 April 2015] Well the southeast end of Clary Lake still had a lot of ice floating around this morning, but David Hodsdon tells me this afternoon that it all disappeared mid-morning today. So the official ice-out date this year is today, April 19th. It’s about average.


09 April 2015: 6″ of new snow better than sharp stick in eye

09_April_2015_campic.jpg“Waking up to 6″ of new snow today was a little better than a sharp stick in the eye” George Fergusson announced at the Whitefield Superette this morning. “but the expression on my wife’s face when she looked out the window was truly pitiable.” George’s recommendation is to get out and make one final snow man before tomorrow’s rain and this coming weekend’s 50° plus temperatures turn today’s winter wonderland into tomorrow’s quagmire of mud. “Before you know it you’ll be doing yard work with a cloud of black flies around your head. This is just a temporary setback.”

27 November 2014: Happy Thanksgiving from the Clary Lake Association

Snap_20141127-072645_ThanksgivingHappy Thanksgiving everyone 🙂 I went out this morning and thawed out the Clary Webcam which was operational, but snow-covered. I thought I’d post a picture of what the lake looks like this morning. At the top of my list of things to be grateful for today is that we still have electricity (and internet) after last night’s snow storm. This means we will be able to bake the turkey we’ve been defrosting for the past 3 days and not have to resort to sitting down to a turkey made out of hotdogs:

o-HOT-DOG-TURKEY-CUT-UP-570

I don’t know about you, but I’d sit down to a bowl of Cheerios for Thanksgiving Dinner before I’d resort to a turkey made of hotdogs. Know what I mean?

Be well, stay warm, and be careful if you’re traveling today.

07 June 2013: Tropical Storm Andrea expected to drop a lot of rain

Tropical storm Andrea is headed north, hot on the heals of an  unnamed low pressure system loaded with moisture and it’s all headed this way. The NOAA Graphical Forecast for Maine for the next 24 hours is forecasting 2.5″ to 3″ of rain from this combined weather event, most of it falling tonight and into early Saturday morning. Possible locally higher amounts likely. Rainfall amounts have been steadily revised upwards since last night; a lot depends on how far off the coast Andrea tracks. If it remains closer to the shore, rainfall amounts could be significantly higher. This forecast is more or less consistent with this morning’s Channel 6 News Center weather report. There is a flood watch in effect for Lincoln County from this evening through Saturday afternoon.

The lake level has dropped about 8″ from a high of about -31″ below the top of the dam on May 31st to about -39″ now. This rain should more than replace what has been lost in the last week. I for one am thrilled.

Careful out there folks.