Category Archives: Technical Lake Stuff

09 October 2017: The Beavers Are Back

DSC_5153
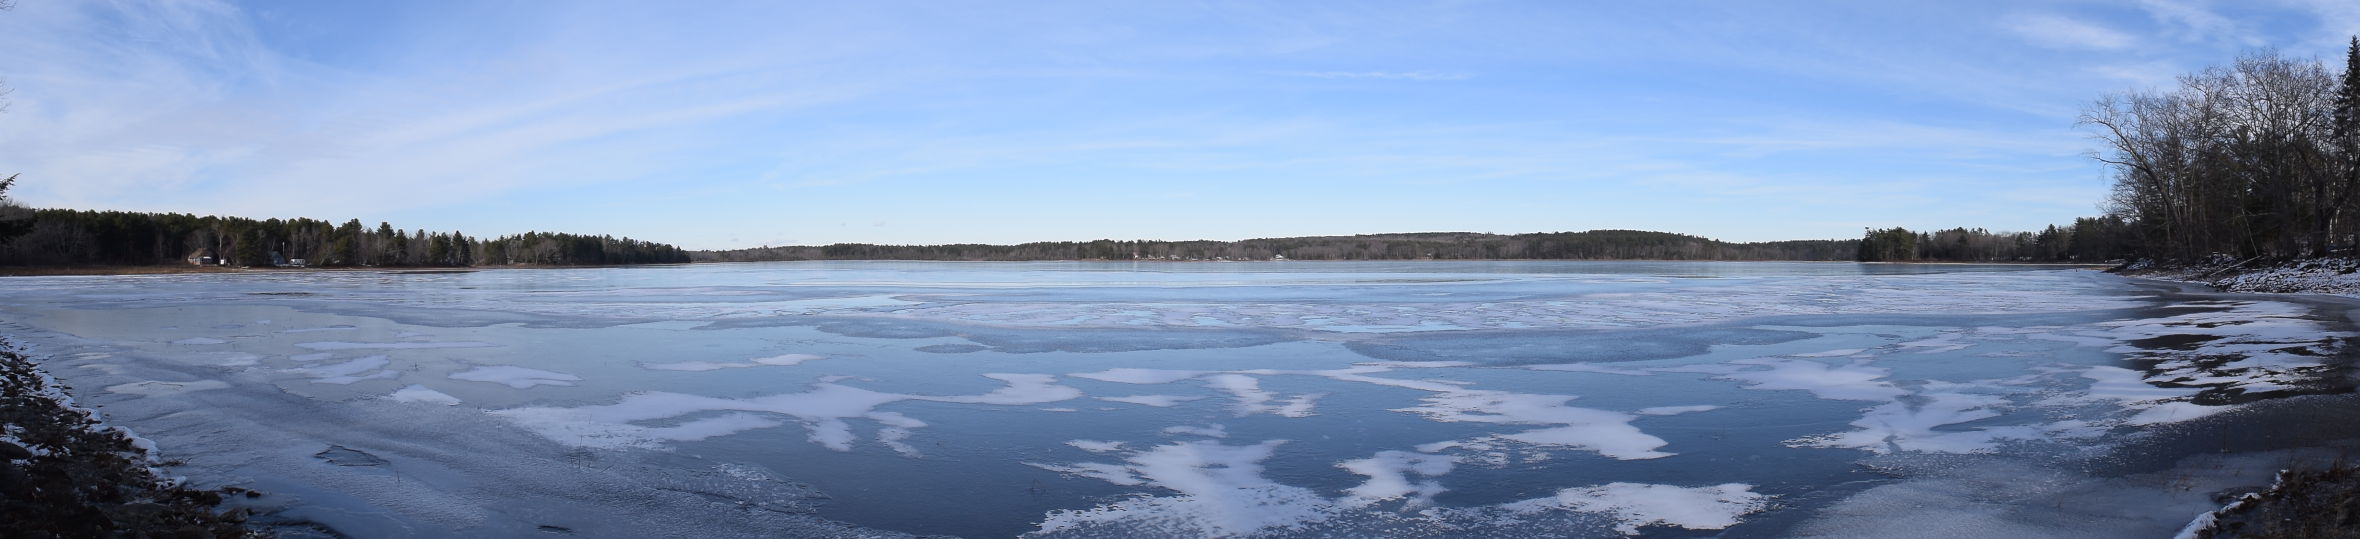
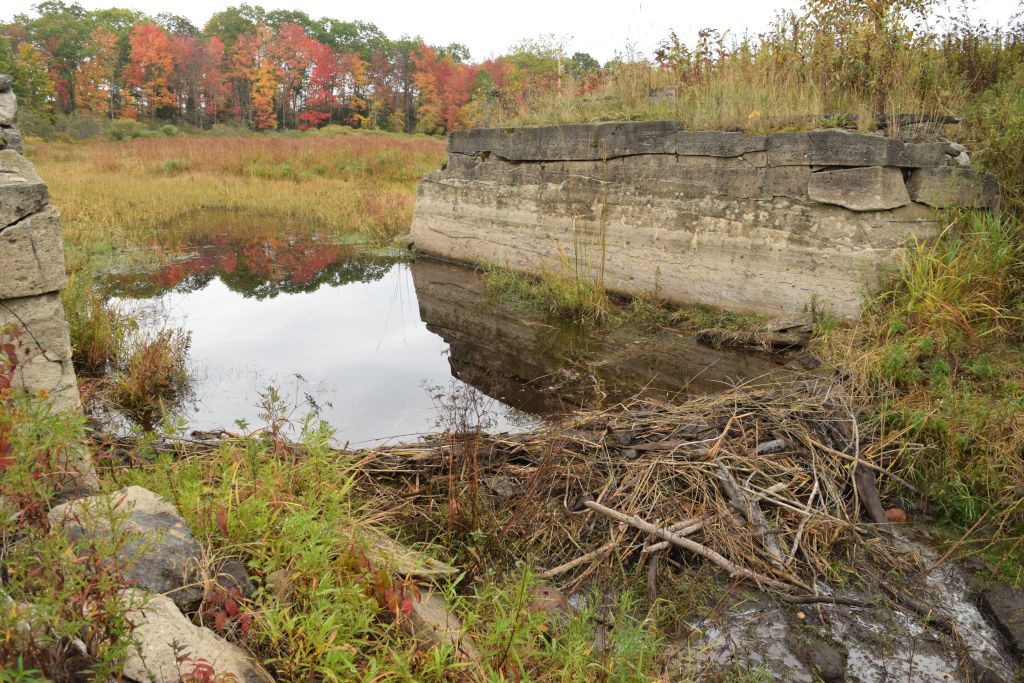
The water level of Clary Lake has effectively bottomed out this fall about a foot higher than it did last fall. I know the outflow rate has been slowed down considerably as a result of thick vegetation in the outlet channel, but that still didn’t explain why the lake hasn’t fallen as low as expected. Today I discovered why: beavers have begun to block the channel at the downstream end of the Narrow Gauge Railroad abutment located at the head of the mill pond (picture at left). The small dam is only about one foot tall but it is already holding back Clary Lake.

DSC_5156
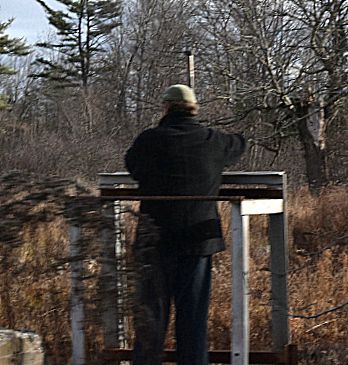
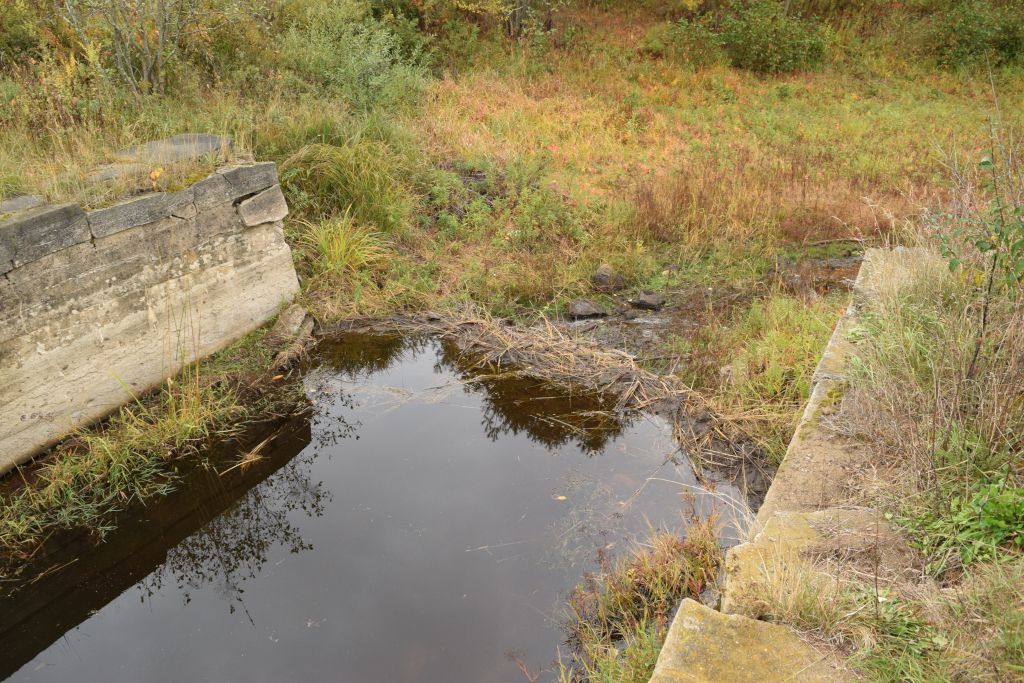
Sadly, I don’t think the beaver responsible for this new dam are going to get a chance to build it much higher: beaver trapping season in this area starts October 29th, and this morning I saw Richard Smith, owner of Aquafortis Associates LLC standing on his side of the Narrow Gauge Railroad abutment talking with someone who looked like (and drove the same red Ford pickup truck as) the person they hired last March to trap out the beaver that had been working to plug up the outlet gate last winter. At least he was driving the same red Ford pickup truck.

DSC_5157
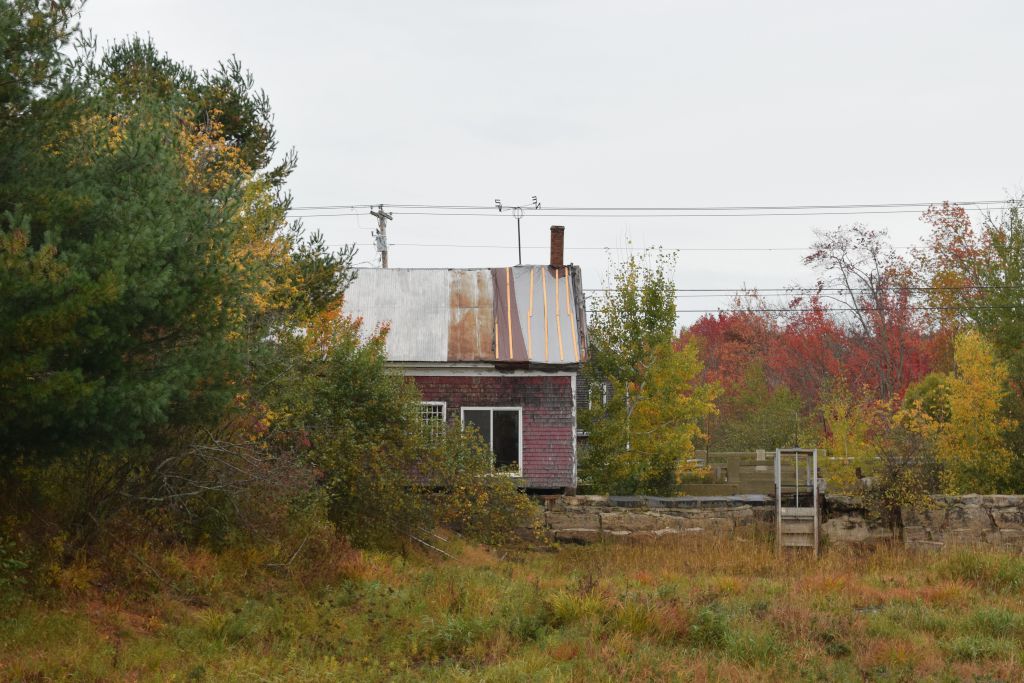
While up at the narrow gauge abutment looking at the new beaver dam, I happened to notice that Kelley and Smith have put a tarp over one side roof of the red building (at left) and fastened it down with battens. Nice to see them maintaining their property.

DSC_5159
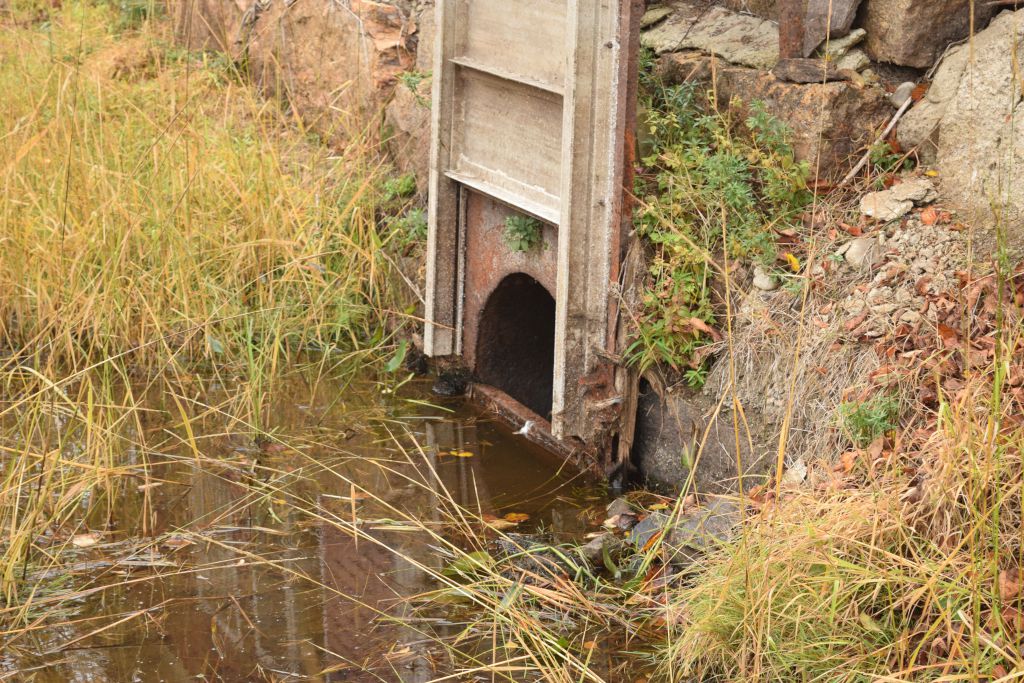
Finally, as I was walking back to my car, I noticed that the gate which has normally been obscured by weeds was fully visible, so I took a picture of it (at left). I’ve known all along that the 34″ diameter gate was partially obstructed, but I always thought is was blocked by a log or rocks or something. However, the picture clearly shows that the gate was built that way: the ‘obstruction” is actually made of steel and completely blocks the bottom third of the gate.

These pictures have been added to the Fall 2017 Photo Gallery.

September 2017 Water Level Chart Archived

9 waterlevelchart_September2017I have archived the September 2017 Water Level Chart (at left). The most notable feature of the September chart is how little the lake level changed over the course of the month: the lake level dropped only 1.56″ from the first day to the last. This didn’t appear to have much if anything to do with the 2.4″ of precipitation received since the lake barely rose after receiving that rainfall. With effectively no water leaving the lake through the channel for the past several months, likely all of the drop (an average of less than 1/10th of an inch per day) was due to evaporation. The lake reached -58.68″ below the normal high water mark on the last day of the month, the lowest level reached so far this year.

We received only 2.37″ of rain in September (average is 3.74″ for the month) bringing us to 23.65″ for the year which is fully 6.28″ shy of where we should be at this time. According to the National Integrated Drought Information System we’re in MODERATE drought, not as dry as we were last year at this time, but still pretty dry.

Looking at September in light of the lake level trend for the year, the lack of rainfall in 2017 has resulted in a slow but steady decline in water level without any of the ups and downs usually present due to normal precipitation. This lack of “volatility” over the spring and summer is especially noticeable on the Water Level Chart covering the period December 2011 through the current date (above). From December 2011 until the spring of 2015, the lake level during the summer fluctuated up and down considerable whereas since the spring of 2015, after reaching a high in April, the lake level has pretty much steadily fallen to it’s low in October. In 2015, 2016, and so far in 2o17, precipitation has been significantly below average.

This year, the lake reached a high of -8.76″ below the normal high water mark on April 13th, thanks in part to the effort of some beavers who managed to at least partially plug up the dam outlet. This was the highest water level we’ve seen in SEVEN YEARS, since 2010. On a marginally bright note, the lake level effectively bottomed out this year about a foot higher than it did last year. I attribute this to profuse vegetation in the channel which has hampered lake outflow.

While the lack of rainfall has been hard on people’s gardens and wells, the lack of rainfall and resulting runoff has been generally good for Clary Lake’s water quality which has maintained better than average transparency throughout the summer in spite of the drastically low-water conditions. Secchi disk readings this summer never once fell below 3 meters (see our Clary Lake Water Monitoring Data page). David Hodsdon and I are heading out later this morning to collect more water quality data and I expect transparency to have improved even further.

August 2017 Water Level Chart Archived

8 waterlevelchart_August2017

August 2017

I have archived the August 2017 Water Level Chart (at left). The most notable feature of the August chart is the same thing that stood out in the June and July charts: how slowly the lake level fell especially considering how little rainfall we’ve received. The lake level fell steadily over the course of the month with the exception of a small blip up on the 19th of the month as the result of what passes for heavy rains these days. Over the course of the month of August the lake lost and average of only 0.16″ per day, falling only 4.68″ over the course of the entire month. In July it fell 0.21″ per day and in June, 0.38″ per day. These rates of fall are fully 1/2 of what one would expect given the water level. As I stated in last month’s posting, it appears the retarded outflows are the result of the outlet channel being clogged with plant growth. Continue reading

July 2017 Water Level Chart Archived

7 waterlevelchart_July2017

July 2017

I have archived the July 2017 Water Level Chart (at left). The most notable feature of the July chart is how slowly the lake level fell especially considering how little rainfall we received over the month. We saw this same phenomena in June but it was even more pronounced in July. In July the lake level fell an average of only 0.21″ per day, falling a total of only 6.48″ over 31 days which is even more remarkable considering we only received 0.95″ of rain in July. For comparison, in June we the lake level fell only 0.38″ per day for a total of 11.4″ drop for the month during which we received only 1.88″ of rain. Average rainfall for July is 3.43″ so for the month we were 2.48″ low and for the year we’re 3.9″ shy of the average.

Back in June I was hard put to explain why the lake level was dropping so slowly, but the reason has finally become clear: the outlet channel is so full of plant growth that it’s impeding the outflow of water from the lake. Go figure. Continuing plant growth also explains why the outflow rate has continued to slow in July and will likely slow even further in August. Outflow at the dam is just a trickle now, and fully half of the daily drop in lake level is due to evaporation.

June 2017 Water Level Chart Archived

6 waterlevelchart_June2017

June 2017

I have archived the June 2017 Water Level Chart (at left). The most notable feature of the June chart is the slow steady decline in the water level on the one hand, and how little the lake level actually fell over the course of the month. The water level fell or remained unchanged every day except the last day of the month when it rose a small fraction as the result of 0.46″ of rain received. That said, the lake only lost a total of 11.4″ in 30 days for an average drop of 0.38″ per day. With the lake at this general level, with the gate wide open, and with so little rain having fallen, I would have expected the lake to have dropped more like 22″ to 24″ over the course of the month- twice as much as it actually fell. I am at a loss to explain this except to speculate that either a) there was considerably less water leaving the lake than expected or b) there was a lot more water entering the lake than expected or c) a combination of both a and b. This bears investigation. Continue reading

[UPDATED]: May 2017 Water Level Chart Archived

5 waterlevelchart_May2017

May 2017

I have archived the May 2017 Water Level Chart (at left). The most notable feature of the May chart is how much rain fell on us during the month. Most of you will agree that May was a cold,  wet month.  Average rainfall for May is 3.7″ and we received just over 5.1″ or 1.4″ more rain than usual. This brings us to 16.24″ for the year which is only slightly more than the average rainfall of 15.91″ for this date. As a result of the extra rainfall, on average the lake level fell only 0.4″ per day rather than the expected 1″ per day, resulting in a total drop for the month of only 13.56″: we started the month at -20.5″ below the high water mark, and ended the month at -34.1″ below the high water mark.

Not much else to say about this.

[UPDATE]: Revised to show additional rainfall received when some late evening thunder storms rolled through. As a result of that extra rainfall, the lake level this morning is unchanged from yesterday morning’s reading.

2017 Season Lake Water Quality Monitoring Resumes

Last Friday morning, May 12th, David Hodsdon and I resumed water quality monitoring on Clary Lake for the 2017 season. Jack Holland usually joins us but was unable to join us for this first data gathering session. Normally we venture out onto the lake every 2 weeks from May through September to the “deep hole” (30′ deep when the lake is full) where we anchor and collect data which we periodically send in to the Maine Volunteer Lake Monitoring Program. The data collected includes water depth, secchi disk (transparency) readings, water temperature and dissolved oxygen data at the surface at every meter down to the bottom, as well as air temperature, current weather conditions, wind speed, etc. You can view a subset of the collected data for recent years on our Clary Lake Water Monitoring Data page.

In addition to periodically submitting water quality data to the VLMP, secchi disk readings are also added to the Near Real-Time Lake Data site. Clary Lake has been participating in the VLMP since 1975.

April 2017 Water Level Chart Archived

4 waterlevelchart_April2017

April 2017

I have archived the April 2017 Water Level Chart (at left). The most notable feature of the April chart is that the lake level rose above the -2 foot mark on April 7th and stayed above that level for the next 24 days, until the end of the month. It also reached -8.76″ below the high water mark when the ice went out on April 13th, which is the highest level I have recorded since I starting making water level measurements back in December 2011. However, the Clary Lake Water Level Order calls for the lake level to be maintained at the normal high water mark from ice out until August 1st and that “at no time during this period shall the lake level be artificially manipulated to be lower than the established normal high water line” so as high as it was, it still fell short of the requirements of the Order. No soup for you, Mr. Kelley.

We received 4.20″ of precipitation during the month of April or about 0.42″ more than the average of 3.78″ bringing us to 10.18″ for the year, or about 2″ below normal. The drought conditions we experienced last summer and fall have been fully relieved with ground water supplies back more or less to normal.

It remains to be seen what the lake level will be like this summer. 

18 April 2017: Spring Musings and a Look Ahead

firetruck on clary

Isn’t it time to get a dry fire hydrant installed at the inlet of the lake on Route 126?

[dropcap]I[/dropcap] try to keep this news forum factual and informative and not all that speculative. From time to time however I am compelled to offer up some commentary on what has been happening, where we are and where it looks like we are headed. This is one of those times. My goal is to bring some perspective and commonality into our lives where they intersect with Clary Lake and the travails that have assaulted it for so long. Spring is a good time for this kind of musing: it’s a time to wake up, gear up, get in shape, and get ready for another season. I feel this is going to be an important year, that a lot is going to happen. We may not see a resolution of our water level crisis this year but then again we might, the problem being that I really have no idea what a “resolution” might look like. Certainly we’ll see some real progress towards a resolution. Not only am I prepared to be surprised, I expect to be. If one thing has been proven time and time again it is that we have no idea what lies around the next corner. Continue reading

March 2017 Water Level Chart Archived

3 waterlevelchart_March2017

March 2017

I have archived the March 2017 Water Level Chart (at left). The most notable feature of the March chart is the relatively stable water level throughout the entire month. The water level started out at -36.48″ below the high water mark [HWM], hit a high four days later of -30.48″ below the HWM on the 4th, and after falling very gradually it ended the month only 2.28″   lower than it started, at -34.20″ below the HWM, and this with the gate wide open for the entire month! Where did the runoff come from to offset all the water leaving the lake? Continue reading

February 2017 Water Level Chart Archived

2 waterlevelchart_February2017

February 2017

I have archived the February 2017 Water Level Chart (at left). The most notable feature of the February chart is how relatively stable the lake level was for the month, considering we received 1.44″ of precipitation, well below the average precipitation for February of 2.44″ (for Augusta). The lake level started the month at -37″ below the Normal High Water Mark (NHWM) and dropped to a low of -44.6″ on February 21st before ending the month 1/2″ higher than it started, at -36.5″ below the NHWM. The dam’s gate remained half open for the entire month, though the dam owner felt compelled to open it all the way on the first day of March, an action consistent with his observed behavior of trying to keep the lake level below the hole in the dam which is somewhere around -34″ below the top of the dam. There was no water flowing through the hole when I drove by the dam yesterday.

15 February 2017: Temporarily Halting Water Level Measurements

We ended up with 24″ of snow by the time the February 2017 “Valentine’s Day Blizzard” was over.

What with the 3′ and 4′ snow drifts between my house and the lake, 18″ of ice ON the lake, and even more snow coming tonight, I’ve decided to take a break from my daily water level measurements. When spring springs I’ll resume my daily readings again. After this next storm it sounds like we’re in for a stretch of warm weather, and that may open things up enough for me to resume, so perhaps this hiatus may be short lived. We’ll see.

I’ll continue to record precipitation and will try to get at least an approximate water level reading once in a while.

January 2017 Water Level Chart Archived

1 waterlevelchart_January2017

January 2017

I have archived the January 2017 Water Level Chart (at left). The most notable feature of the January chart is nothing, really. Kind of a ho-hum chart if you ask me. The lake level was at -48″ below the normal high water mark (HWM) at the start of the month and ended the month at -36.5″ or about a foot higher. The lake level was severely low for the whole summer and fall so seeing the lake rise marginally higher has been comforting. That said, the gate on the dam has been open about half way for the entire month, considerably more than the opening called for in the Water Level Order. Anyway you want look at it, the dam owner is still in clear violation of the Clary Lake water level order.

We received 2.84″ of precipitation during the month, some in the form of snow and some as rain. Average precipitation for January is 2.6″ so we’re starting the month a little ahead for a change.  We started this year in Severe drought (drought intensity D2) but we’re now in Moderate drought (drought intensity D1) however with the ground frozen, very little water is going to get into the water table until spring.


December 2016 Water Level Chart Archived

12 waterlevelchart_December2016

December 2016

And so we come to the end of another year (#5) of water level measurements. I have archived the December 2016 Water Level Chart (at left) and the Whole Year 2016 chart (see below). The most notable feature of the December chart is the the fact that lake only came up 8.76″ over the course of the month despite us having received 3.88″ of precipitation; this is a runoff multiplier of only 2.25X or about 1/2 of what it should be this time of year, even with a low water table. No doubt the reason for this is because the dam’s gate was mostly open for almost the entire month. Normally with the ground frozen and having received that much rain, the lake would have risen twice as much. Continue reading

11 December 2016: Clary Lake Fully Iced Over [UPDATED AGAIN]

UPDATED AGAIN: David Hodson emailed me this afternoon to say that the final patch of open water has finally frozen over making the official Ice-In date this year December 12. Honest!

UPDATED: Clary Lake NOT fully iced over. David Hodsdon and I conferred this morning and he told me his end was fully frozen over, but he failed to notice about 1/2 an acre of open water in the cove by Jack Holland’s house. I guess there were some geese swimming in it this afternoon. Oh well. Retraction time. Stay tuned!

Thanks to overnight temperatures around 0° Clary Lake was completely frozen over this morning. It remains to be seen if the ice cover can survive the rain, snow and warmer temperatures forecast over the next couple of days.

DSC_3576-ice-in-11-december-2016

View Full Sized Image

03 December 2016: Clary Lake Dam Gate Fully Opened Today

kelley_at_dam_12-03-2016

Clary Lake dam owner Paul Kelley, Jr. opening the dam’s gate today, December 3, 2016.

Today the Clary Lake dam owner was seen opening the dam’s gate (pictured at left) shortly after meeting on-site with a Lincoln County Deputy. I have no idea why Mr. Kelley summoned the police to his property or whether it had anything to do with his decision to open the gate today, but I was told by a passerby that he and the officer were seen standing on the road in front of the dam before he opened the gate and that Mr. Kelley looked “upset” and was “waving his arms” and pointing at the dam. I can’t imagine what Mr. Kelley’s problem might be.

The gate has been effectively closed since mid-summer, and I have been wondering if or when Mr. Kelley was going to open the gate this fall to provide the Minimum Flows required in the Clary Lake Water Level Order . Flows vary throughout the year: between November 16th and December 31st the Order says the gate should be opened 0.9 feet to provide 15.5 cfs (cubic feet per second) of outflows. Mr. Kelley has in fact opened the gate all the way, approximately 2.5 feet, letting out way more water than the recommended volume. Clearly, Mr. Kelley had more on his mind today than just meeting the minimum flows requirement, and he isn’t particularly interested in garnering anything like goodwill either. It seems to me Mr. Kelley could use a little of that about now.

By early afternoon the water level in the mill pond behind the dam had fallen noticeably. I’ve revised the Water Level Charts to reflect the change in gate status.

November 2016 Water Level Chart Archived

11 waterlevelchart_November2016

November 2016

I have archived the November 2016 Water Level Chart (at left). The most notable feature of the November chart, like most of the other charts this past summer and fall, is how slow the lake level has been responding to rainfall. I am dismayed at the abysmal rate Clary Lake is filling up this fall and I’m sure a lot of you share that sentiment. Despite having received what seems like a “reasonable” amount of rain over the past two months, the lake level stubbornly refuses to rise as expected. The lake dropped to 60″ below the high water mark back on July 27th and continued from there to drop to a record low of -67.25″ on October 8th. Since then we’ve received 7.31″ of rain which has brought the lake up only a hair over 7″ to -60.17″ below the high water mark on the last day of the month. In a “normal” year that much rain would have brought the lake up the better part of 30 inches or more. Continue reading

29 November 2016: Maine VLMP Fall 2016 Newsletter now available

vlmp_2016_newsletter

The Maine Volunteer Lake Monitor Program (VLMP) has issued their Fall 2016 newsletter “the Water Column” and it’s available online from their website at the following link:

Fall 2016 Water Column Newsletter

The VLMP has always done a great job with their newsletters, and this one is no exception: with 28 pages of informative articles, reports, and pictures, it is well worth taking the time to look it over. I found the article “The 2016 Drought and it’s Effect on Maine Lakes” particularly interesting.

The Clary Lake Association is long-time supporting member of the VLMP and has been contributing water quality monitoring data to the VLMP program since 1975. You’ll find the last 5 years worth of water quality data on our Clary Lake Water Monitoring Data page.

The newsletter includes a report and pictures from this summer’s 2016 Lake Monitoring Conference which David Hodsdon and I attended. Below is the group photograph taken at the conclusion of that event:

vlmp_2016_conference_photo


05 November 2016: Water Level Charts Updated

Clary_Lake_and_Meadow_Depth_Map_version_1.3When I announced that the DEP had finally established the elevation of the normal high water line of Clary Lake, I said I would be changing my water level measurement regimen to match and would post an update about those changes when they happened. Well, they happened. Nothing earth shaking to report, but there are a few things to make note of. Since I’ve been using NAVD88 elevations all along the only thing needing to change was the index value to which water levels are referenced. Telling people the water level is 148.76′ today really doesn’t impart any useful information, which is why I’ve always stated water levels in inches with respect to the top of the dam. From now on I will reference them in inches, to the normal high water line, which is very close to the top of the dam. Data collection and basic data manipulation remains the same. The Water Level Charts themselves received a few obvious edits- the left hand axis on the charts is now “Inches Below Normal High Water” instead of “Inches Below Top of Dam” and the legend has been updated to reflect this change. The difference between the two (0.22′ or 2.59″) is so small as to not be visible on the actual water level charts. Zero on the left-hand scale used to be Top of the Dam. It is now the Normal High Water Line. Continue reading

04 November 2016: DEP Establishes Clary Lake High Water Elevation

high-water-mark.jpgFor the past 5 years I’ve been referencing Clary Lake water levels to the “top of the dam” for the simple reason that the actual elevation of the Normal High Water Line of Clary Lake has never been established. I knew from my own observations (picture at left) that the historical normal high water line has always been at or very near the top of the dam so it made sense to use the top of the dam both as a reference for my measurements, and as a proxy for the high water line. The picture at left shows a boulder with a distinct black stain showing the prolonged effect of the action water that corresponds to the approximate high water line of Clary Lake.

When the Clary Lake Water Level Order was issued back in late January 2014, the water level regime specified therein only referred to the “historical normal high water line” of Clary Lake without stating what the actual elevation of that line on the earth was. Special Condition #4 of the WLO required the dam owner to hire a Professional Land Surveyor to conduct an elevation survey whose job would be to establish the actual elevation of the Normal High Water Line of Clary Lake, which is defined as follows:

Normal High Water Line. “Normal high water line” means that line along the shore of a great pond, river, stream, brook or other non-tidal body of water which is apparent from visible markings, changes in the character of soils due to prolonged action of the water or from changes in vegetation and which distinguishes between predominantly aquatic and predominantly terrestrial land, 38 M. R.S. S.480-B (6)

The problem is, the dam owner didn’t comply with Special Condition #4 and in June 2014 the Department sent him a Letter of Warning for failing to provide a satisfactory survey. Continue reading