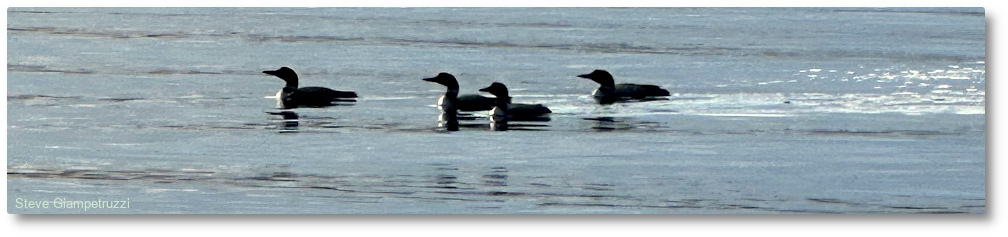
Category Archives: Technical Lake Stuff

20 April 2018: Clary Lake is (Finally) Ice Free!

Clary Lake is finally ice free! Much of the lake has been free of ice for the past 4-5 days,  but there was a large raft of ice down in the east end by the State boat launch that refused to dissipate. That ice is gone as of this morning. The loons are back and there are ducks and geese all over the place. I love spring! Historically, April 20th is a little late, but not by much. We have ice-in and ice-out dates going back to 2001:

I plan to get my boat in the water this weekend. Let the boating season begin!

March 2018 Water Level Chart Archived

3 waterlevelchart_March2018

March 2018

I have archived the March 2018 Water Level Chart (at left). The most notable feature of the March chart is how little the lake level fell over the course of the month despite the lack of precipitation received (less than an inch all told). This (relatively) stable level was likely the result of channel friction due to heavy ice cover in the march and increased runoff from ground water and melting snow partly making up for the outflows from the dam. Precipitation for the month was only 0.91″ which is way below the March average of 3.39″ putting us at only 7.00″ for the year to date, 1.43″ below normal. Hopefully spring rains will make up the difference. I only measured the lake level 13 times in March and nobody seemed to notice 🙂

February 2018 Water Level Chart Archived

2 waterlevelchart_February2018

February 2018

I have archived the February 2018 Water Level Chart (at left). The most notable feature of the February chart is how little the lake level changed over the course of the month despite the gate being wide open and with no major precipitation events to generate runoff. We started the month at -29.28″ below the normal high water mark and ended the month at -33.24″ below the normal high water mark, only 3.96″ lower that we started. The lake level was also above the hole in the dam for the whole month, increasing the amount of water leaving the lake. Nonetheless, the lake level stayed pretty flat for the month; I attribute the relatively stable lake level to reduced outflows as a result of channel friction and ice cover in the marsh which has been unusually thick this winter. Precipitation for the month was 2.28″ which is a little less than the historical average of 2.44″ for the month of February. Year to date our precipitation total is 6.09″ which is an inch more than average.

January 2018 Water Level Chart Archived

1 waterlevelchart_January2018

January 2018

I have archived the January 2018 Water Level Chart (at left) starting us off on another year of sub-par water levels. The most notable feature of the January chart is that the lake level actually made it up into the “allowable” range (for this time of year), reaching a high of -19.08″ below the normal high water mark on January 15th as the result of nearly 2.5″ of heavy rains and snow melt. Gotta love January thaw! I had stopped making measurements on December 31st but the warm weather and rapidly rising lake level made getting down to the lake and actually finding the water surface relatively easy.

Precipitation for the month of January was 3.81″ most of which we received in a big storm in the middle of the month. Average for January is only 2.6″ so already we’re 1.2″ above normal for the year, but the year is just starting.

All told I only made 8 water level measurements for the month of January and I don’t expect to resume measurements on anything like a regular basis until sometime spring. I’ll try and grab a few measurements between now and then if the opportunity presents itself.

13 January 2018: Water Level Chart Updated

The Clary Lake water level charts have been updated for the first time this year. I hadn’t expected to resume water level measurements yet, but heavy overnight rains not only melted all the snow in my yard but also the ice around the edge of the lake making it too easy to obtain a water level measurement. The lake level is now -30.48″ below the normal high water mark having risen 11.76″ from my last measurement back on December 31st. It remains to be seen whether I’m back to a regular, daily measurement routine. Probably not, but ever the opportunist, I’ll snag an occasional water level measurement this winter when the opportunity presents itself.

Tim Chase recorded 2.4″ of precipitation at his Grand Army Weather Station. I for one am glad it wasn’t in the form of snow… 

December 2017 Water Level Chart Archived

12 waterlevelchart_December2017I have archived the December 2017 Water Level Chart (at left) bringing us to the end of another year of sub-par water levels. The most notable feature of the December chart is how little the lake level changed over the course of the month despite below average precipitation for the month; the lake level started out the month at -43.32″ below the normal high water mark and ended the month just a hair more than 1″ higher at -42.24″ all in all pretty much flat for the whole month. We only received 2.16″ of precipitation, a good inch less than average. We ended the year at 37.60″ of precipitation, almost 4.5″ less than average. We’ve already got a pretty good snow pack started so I expect ground water supplies will be well replenished come spring. Continue reading

November 2017 Water Level Chart Archived

11 waterlevelchart_November2017

November 2017

I have archived the November 2017 Water Level Chart (at left). The most notable feature of the November chart is… nothing 🙂 There is nothing particularly notable, or remarkable, about November’s water level chart. The lake level managed to rise 3.24″ over the month, ending marginally higher than it started.

Rainfall in November was well below normal but still enough, with a fully-recharged water table, to keep the lake level rising marginally. We received only 2.85″ of rain, 1.52″ less than average for November. This brings us to 35.44″ for the year which is still 3.23″ below normal for this date despite the almost 9″ of rain we received in the end of October.

October 2017 Water Level Chart Archived

10 waterlevelchart_October2017I have archived the October 2017 Water Level Chart (at left). The most notable feature of the October chart is how flat the lake level was and how little it rose despite heavy rains at the end of the month.  We received almost 9″ of rain in the last week of October. Despite the rain, we’re still several inches short for the year. I’m at the Sheepscot General, we’re currently without power and internet so I’m going to cut this post short.

27 October 2017: Much Needed Rain Has Little Effect On Clary Lake Water Level

We just received 5.15″ of rain in a little over 2 days which, had we not been suffering under drought conditions, would have brought the lake up close to two feet or more. However because so much of the rainfall ended up soaking into the ground and not running off into the lake, the water level has only come up 7.44″ yielding a pathetic runoff multiplier of about 1.4X. Now that the ground is pretty much saturated, we should get more bang for the buck from the next rain storm due in this coming Sunday and Monday.

09 October 2017: The Beavers Are Back

DSC_5153The water level of Clary Lake has effectively bottomed out this fall about a foot higher than it did last fall. I know the outflow rate has been slowed down considerably as a result of thick vegetation in the outlet channel, but that still didn’t explain why the lake hasn’t fallen as low as expected. Today I discovered why: beavers have begun to block the channel at the downstream end of the Narrow Gauge Railroad abutment located at the head of the mill pond (picture at left). The small dam is only about one foot tall but it is already holding back Clary Lake.

DSC_5156Sadly, I don’t think the beaver responsible for this new dam are going to get a chance to build it much higher: beaver trapping season in this area starts October 29th, and this morning I saw Richard Smith, owner of Aquafortis Associates LLC standing on his side of the Narrow Gauge Railroad abutment talking with someone who looked like (and drove the same red Ford pickup truck as) the person they hired last March to trap out the beaver that had been working to plug up the outlet gate last winter. At least he was driving the same red Ford pickup truck.

DSC_5157While up at the narrow gauge abutment looking at the new beaver dam, I happened to notice that Kelley and Smith have put a tarp over one side roof of the red building (at left) and fastened it down with battens. Nice to see them maintaining their property.

DSC_5159Finally, as I was walking back to my car, I noticed that the gate which has normally been obscured by weeds was fully visible, so I took a picture of it (at left). I’ve known all along that the 34″ diameter gate was partially obstructed, but I always thought is was blocked by a log or rocks or something. However, the picture clearly shows that the gate was built that way: the ‘obstruction” is actually made of steel and completely blocks the bottom third of the gate.

These pictures have been added to the Fall 2017 Photo Gallery.

September 2017 Water Level Chart Archived

9 waterlevelchart_September2017I have archived the September 2017 Water Level Chart (at left). The most notable feature of the September chart is how little the lake level changed over the course of the month: the lake level dropped only 1.56″ from the first day to the last. This didn’t appear to have much if anything to do with the 2.4″ of precipitation received since the lake barely rose after receiving that rainfall. With effectively no water leaving the lake through the channel for the past several months, likely all of the drop (an average of less than 1/10th of an inch per day) was due to evaporation. The lake reached -58.68″ below the normal high water mark on the last day of the month, the lowest level reached so far this year.

We received only 2.37″ of rain in September (average is 3.74″ for the month) bringing us to 23.65″ for the year which is fully 6.28″ shy of where we should be at this time. According to the National Integrated Drought Information System we’re in MODERATE drought, not as dry as we were last year at this time, but still pretty dry.

Looking at September in light of the lake level trend for the year, the lack of rainfall in 2017 has resulted in a slow but steady decline in water level without any of the ups and downs usually present due to normal precipitation. This lack of “volatility” over the spring and summer is especially noticeable on the Water Level Chart covering the period December 2011 through the current date (above). From December 2011 until the spring of 2015, the lake level during the summer fluctuated up and down considerable whereas since the spring of 2015, after reaching a high in April, the lake level has pretty much steadily fallen to it’s low in October. In 2015, 2016, and so far in 2o17, precipitation has been significantly below average.

This year, the lake reached a high of -8.76″ below the normal high water mark on April 13th, thanks in part to the effort of some beavers who managed to at least partially plug up the dam outlet. This was the highest water level we’ve seen in SEVEN YEARS, since 2010. On a marginally bright note, the lake level effectively bottomed out this year about a foot higher than it did last year. I attribute this to profuse vegetation in the channel which has hampered lake outflow.

While the lack of rainfall has been hard on people’s gardens and wells, the lack of rainfall and resulting runoff has been generally good for Clary Lake’s water quality which has maintained better than average transparency throughout the summer in spite of the drastically low-water conditions. Secchi disk readings this summer never once fell below 3 meters (see our Clary Lake Water Monitoring Data page). David Hodsdon and I are heading out later this morning to collect more water quality data and I expect transparency to have improved even further.

August 2017 Water Level Chart Archived

8 waterlevelchart_August2017

August 2017

I have archived the August 2017 Water Level Chart (at left). The most notable feature of the August chart is the same thing that stood out in the June and July charts: how slowly the lake level fell especially considering how little rainfall we’ve received. The lake level fell steadily over the course of the month with the exception of a small blip up on the 19th of the month as the result of what passes for heavy rains these days. Over the course of the month of August the lake lost and average of only 0.16″ per day, falling only 4.68″ over the course of the entire month. In July it fell 0.21″ per day and in June, 0.38″ per day. These rates of fall are fully 1/2 of what one would expect given the water level. As I stated in last month’s posting, it appears the retarded outflows are the result of the outlet channel being clogged with plant growth. Continue reading

July 2017 Water Level Chart Archived

7 waterlevelchart_July2017

July 2017

I have archived the July 2017 Water Level Chart (at left). The most notable feature of the July chart is how slowly the lake level fell especially considering how little rainfall we received over the month. We saw this same phenomena in June but it was even more pronounced in July. In July the lake level fell an average of only 0.21″ per day, falling a total of only 6.48″ over 31 days which is even more remarkable considering we only received 0.95″ of rain in July. For comparison, in June we the lake level fell only 0.38″ per day for a total of 11.4″ drop for the month during which we received only 1.88″ of rain. Average rainfall for July is 3.43″ so for the month we were 2.48″ low and for the year we’re 3.9″ shy of the average.

Back in June I was hard put to explain why the lake level was dropping so slowly, but the reason has finally become clear: the outlet channel is so full of plant growth that it’s impeding the outflow of water from the lake. Go figure. Continuing plant growth also explains why the outflow rate has continued to slow in July and will likely slow even further in August. Outflow at the dam is just a trickle now, and fully half of the daily drop in lake level is due to evaporation.

June 2017 Water Level Chart Archived

6 waterlevelchart_June2017

June 2017

I have archived the June 2017 Water Level Chart (at left). The most notable feature of the June chart is the slow steady decline in the water level on the one hand, and how little the lake level actually fell over the course of the month. The water level fell or remained unchanged every day except the last day of the month when it rose a small fraction as the result of 0.46″ of rain received. That said, the lake only lost a total of 11.4″ in 30 days for an average drop of 0.38″ per day. With the lake at this general level, with the gate wide open, and with so little rain having fallen, I would have expected the lake to have dropped more like 22″ to 24″ over the course of the month- twice as much as it actually fell. I am at a loss to explain this except to speculate that either a) there was considerably less water leaving the lake than expected or b) there was a lot more water entering the lake than expected or c) a combination of both a and b. This bears investigation. Continue reading

[UPDATED]: May 2017 Water Level Chart Archived

5 waterlevelchart_May2017

May 2017

I have archived the May 2017 Water Level Chart (at left). The most notable feature of the May chart is how much rain fell on us during the month. Most of you will agree that May was a cold,  wet month.  Average rainfall for May is 3.7″ and we received just over 5.1″ or 1.4″ more rain than usual. This brings us to 16.24″ for the year which is only slightly more than the average rainfall of 15.91″ for this date. As a result of the extra rainfall, on average the lake level fell only 0.4″ per day rather than the expected 1″ per day, resulting in a total drop for the month of only 13.56″: we started the month at -20.5″ below the high water mark, and ended the month at -34.1″ below the high water mark.

Not much else to say about this.

[UPDATE]: Revised to show additional rainfall received when some late evening thunder storms rolled through. As a result of that extra rainfall, the lake level this morning is unchanged from yesterday morning’s reading.

2017 Season Lake Water Quality Monitoring Resumes

Last Friday morning, May 12th, David Hodsdon and I resumed water quality monitoring on Clary Lake for the 2017 season. Jack Holland usually joins us but was unable to join us for this first data gathering session. Normally we venture out onto the lake every 2 weeks from May through September to the “deep hole” (30′ deep when the lake is full) where we anchor and collect data which we periodically send in to the Maine Volunteer Lake Monitoring Program. The data collected includes water depth, secchi disk (transparency) readings, water temperature and dissolved oxygen data at the surface at every meter down to the bottom, as well as air temperature, current weather conditions, wind speed, etc. You can view a subset of the collected data for recent years on our Clary Lake Water Monitoring Data page.

In addition to periodically submitting water quality data to the VLMP, secchi disk readings are also added to the Near Real-Time Lake Data site. Clary Lake has been participating in the VLMP since 1975.

April 2017 Water Level Chart Archived

4 waterlevelchart_April2017

April 2017

I have archived the April 2017 Water Level Chart (at left). The most notable feature of the April chart is that the lake level rose above the -2 foot mark on April 7th and stayed above that level for the next 24 days, until the end of the month. It also reached -8.76″ below the high water mark when the ice went out on April 13th, which is the highest level I have recorded since I starting making water level measurements back in December 2011. However, the Clary Lake Water Level Order calls for the lake level to be maintained at the normal high water mark from ice out until August 1st and that “at no time during this period shall the lake level be artificially manipulated to be lower than the established normal high water line” so as high as it was, it still fell short of the requirements of the Order. No soup for you, Mr. Kelley.

We received 4.20″ of precipitation during the month of April or about 0.42″ more than the average of 3.78″ bringing us to 10.18″ for the year, or about 2″ below normal. The drought conditions we experienced last summer and fall have been fully relieved with ground water supplies back more or less to normal.

It remains to be seen what the lake level will be like this summer. 

18 April 2017: Spring Musings and a Look Ahead

firetruck on clary

Isn’t it time to get a dry fire hydrant installed at the inlet of the lake on Route 126?

[dropcap]I[/dropcap] try to keep this news forum factual and informative and not all that speculative. From time to time however I am compelled to offer up some commentary on what has been happening, where we are and where it looks like we are headed. This is one of those times. My goal is to bring some perspective and commonality into our lives where they intersect with Clary Lake and the travails that have assaulted it for so long. Spring is a good time for this kind of musing: it’s a time to wake up, gear up, get in shape, and get ready for another season. I feel this is going to be an important year, that a lot is going to happen. We may not see a resolution of our water level crisis this year but then again we might, the problem being that I really have no idea what a “resolution” might look like. Certainly we’ll see some real progress towards a resolution. Not only am I prepared to be surprised, I expect to be. If one thing has been proven time and time again it is that we have no idea what lies around the next corner. Continue reading

March 2017 Water Level Chart Archived

3 waterlevelchart_March2017

March 2017

I have archived the March 2017 Water Level Chart (at left). The most notable feature of the March chart is the relatively stable water level throughout the entire month. The water level started out at -36.48″ below the high water mark [HWM], hit a high four days later of -30.48″ below the HWM on the 4th, and after falling very gradually it ended the month only 2.28″   lower than it started, at -34.20″ below the HWM, and this with the gate wide open for the entire month! Where did the runoff come from to offset all the water leaving the lake? Continue reading