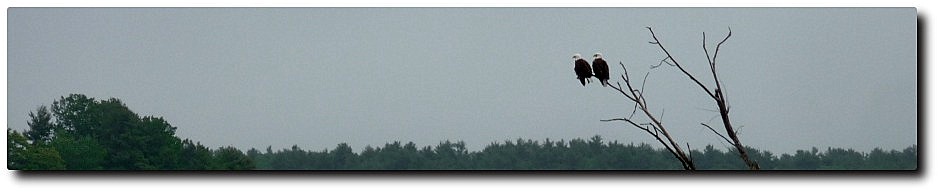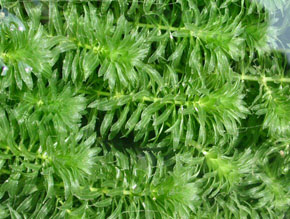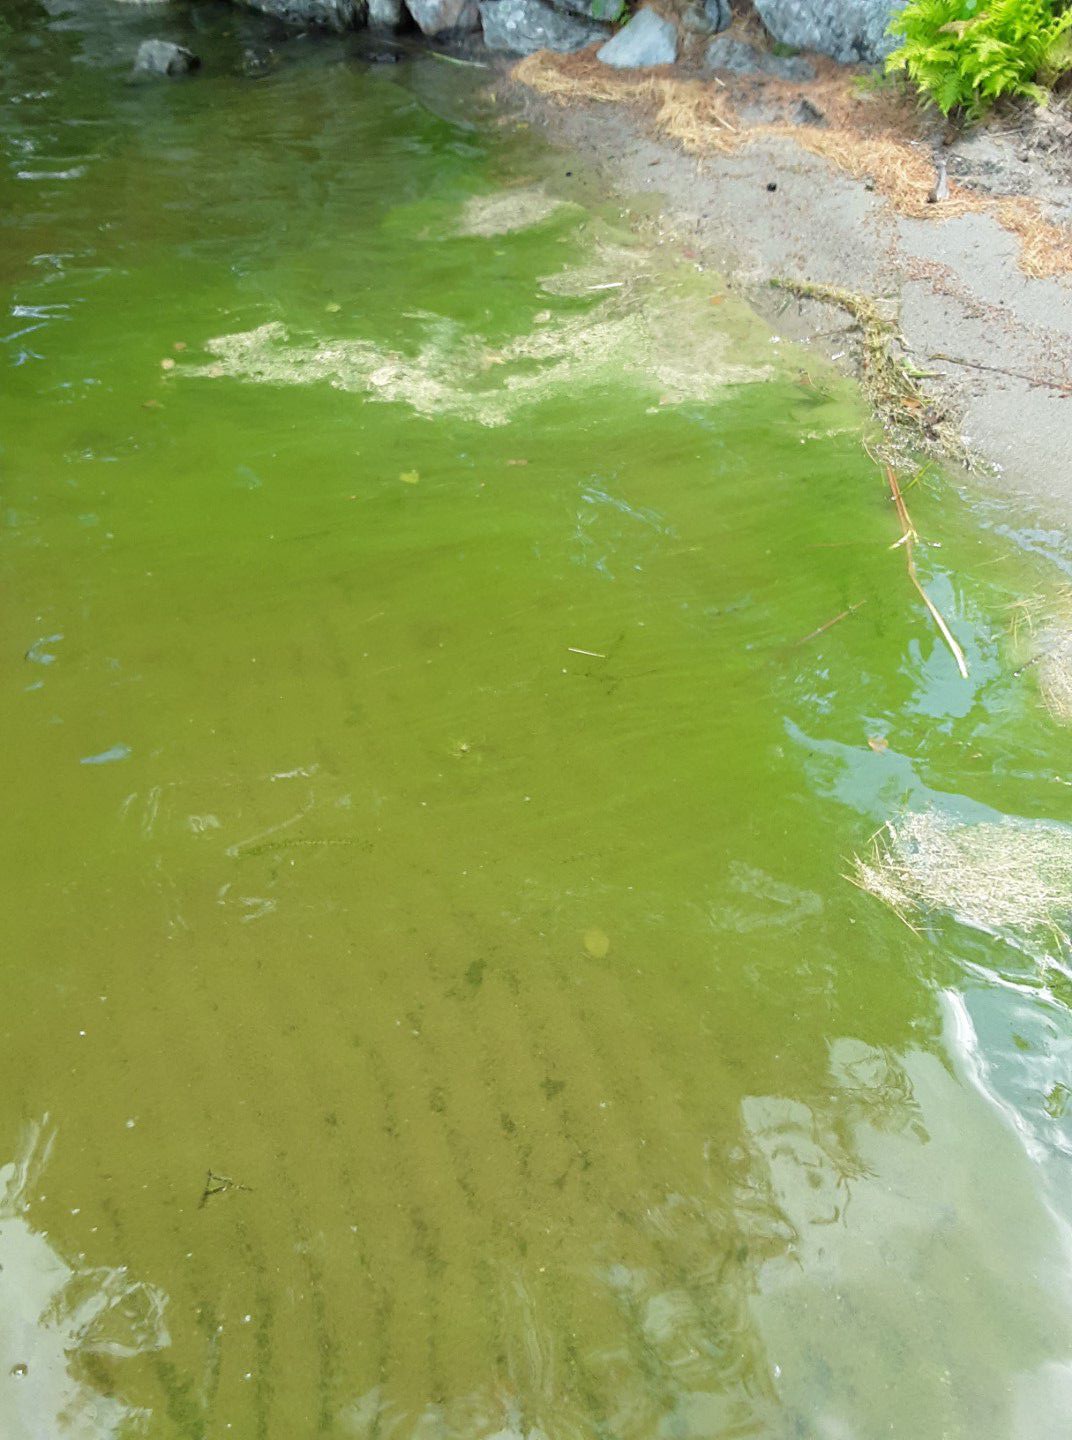
Cyanobacteria coloring the water.
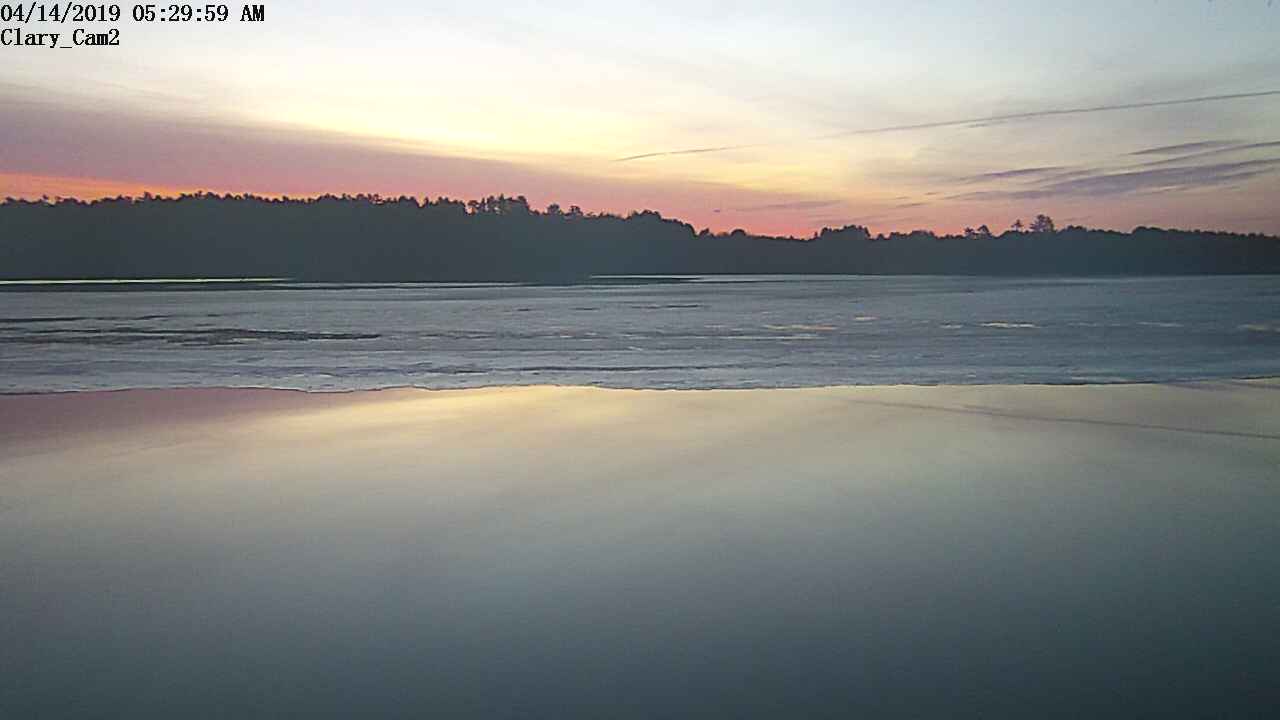
You may have noticed a green scum drifting on the lake surface recently or seen loads of green particles suspended in the water and thought it was pollen. Well, it does look a lot like the pine pollen that was blowing around last week, but that was yellow, and this stuff is green. Clary Lake is actually experiencing moderate blue-green algae growth resulting in an algal bloom. This early season algae bloom has no doubt been fueled by excessive runoff from all the rain this spring (15″ since the 1st of April!) which has introduced Phosphorus and other nutrients into the lake. Phosphorous is the primary food for plants and algae. Blue-green algae technically is a phylum of bacteria (cyanobacteria) that obtain their energy through photosynthesis. Another likely source of Phosphorus is rotting terrestrial vegetation. For years, better than 300 acres of drained wetlands have been growing grass, goldenrod, alders, and other terrestrial plants and that land is now under water, and the vegetation is rotting. This releases nutrients including Phosphorus in the water, helping to fuel aquatic plant and algae growth. Here are a few more photographs:
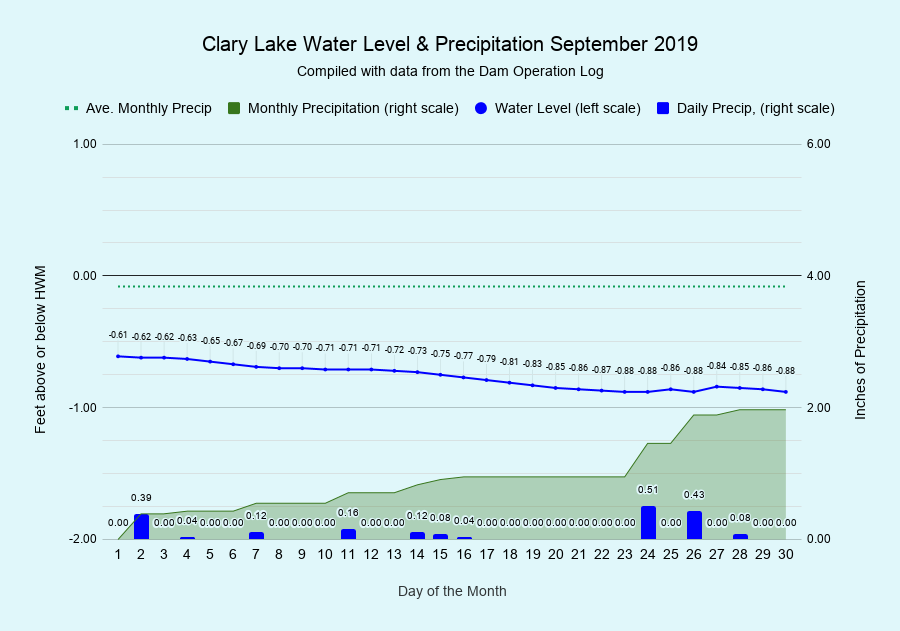
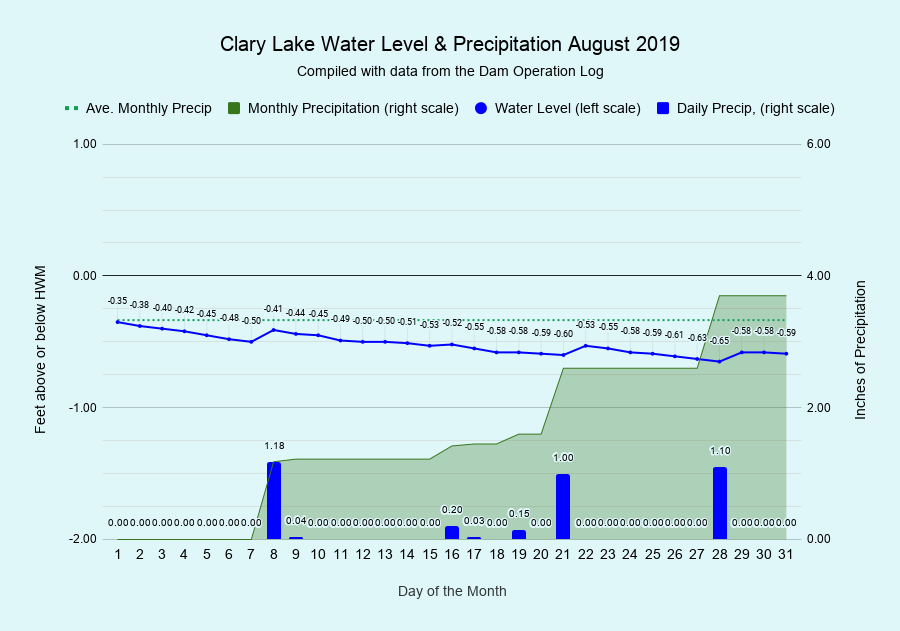
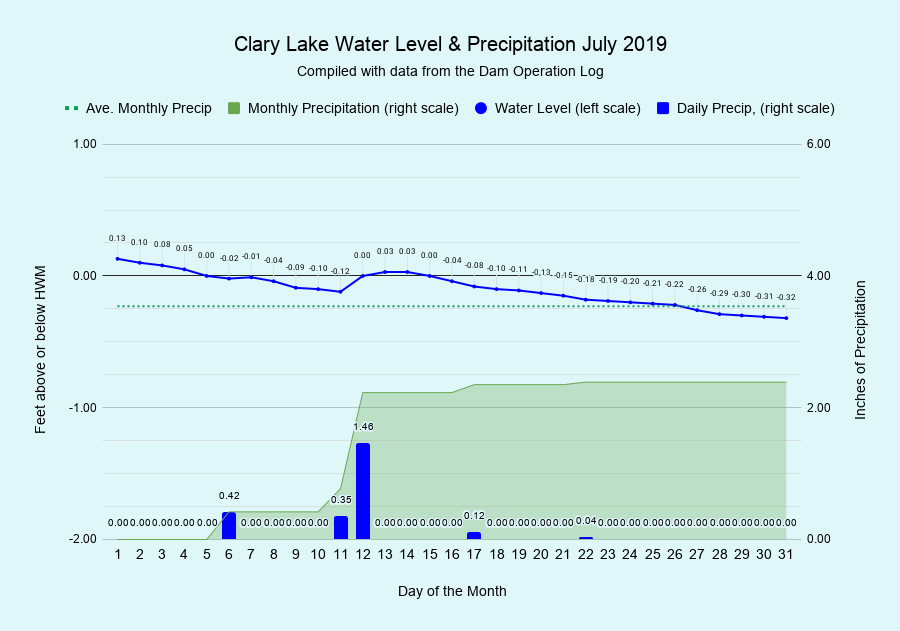
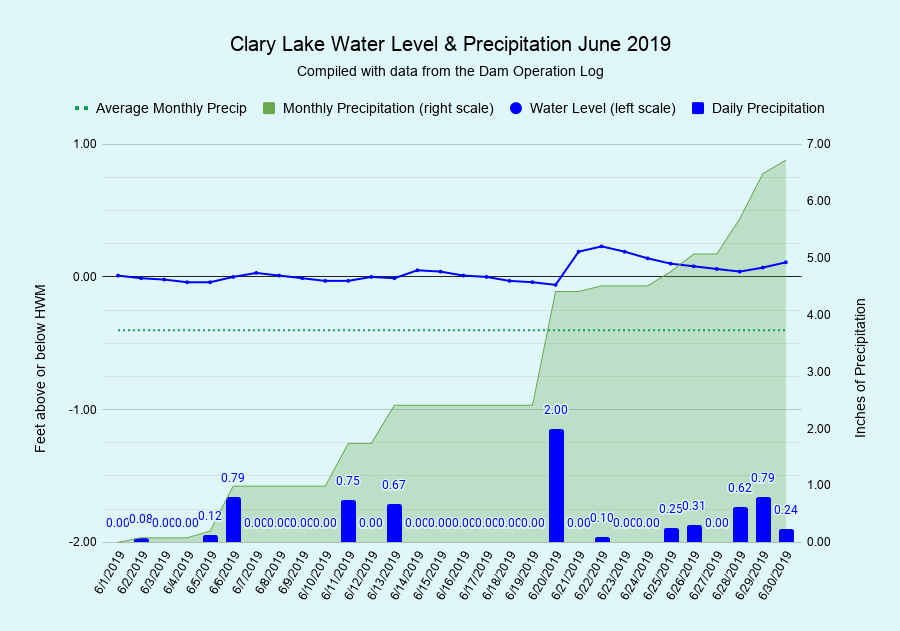
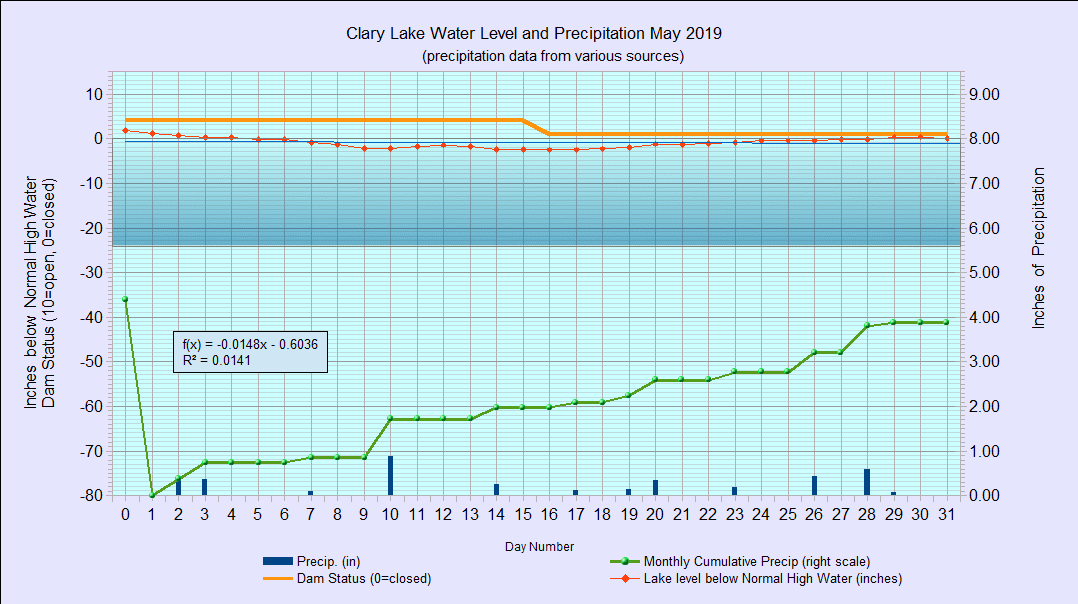
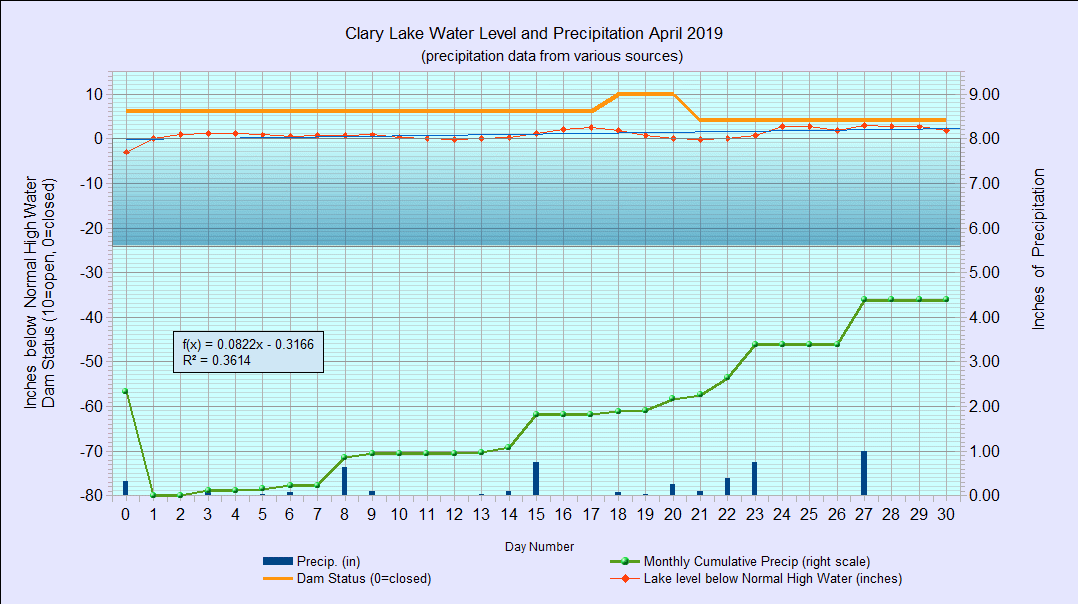
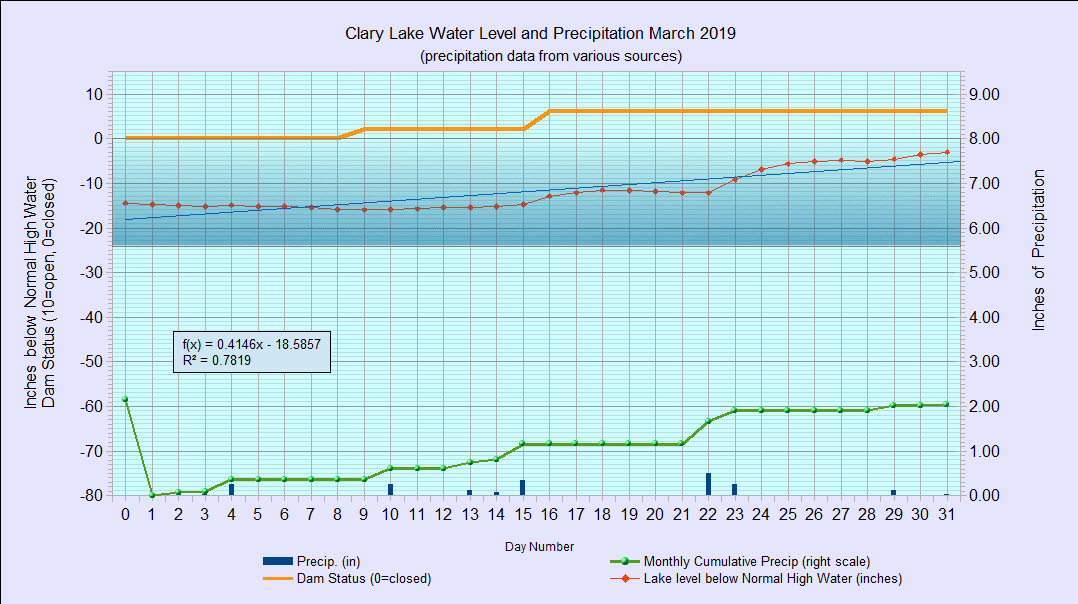
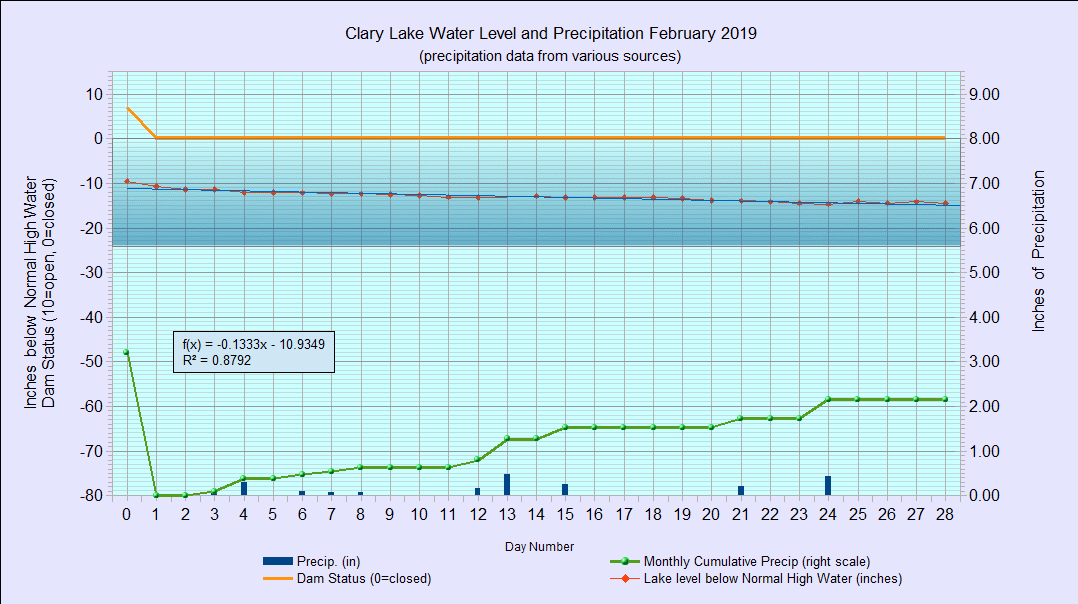
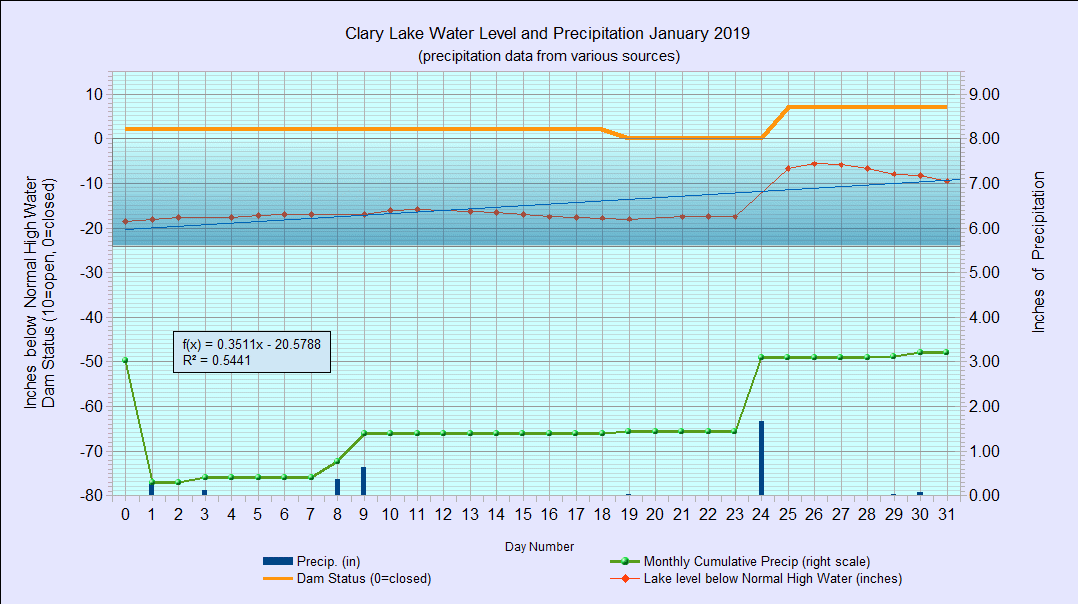
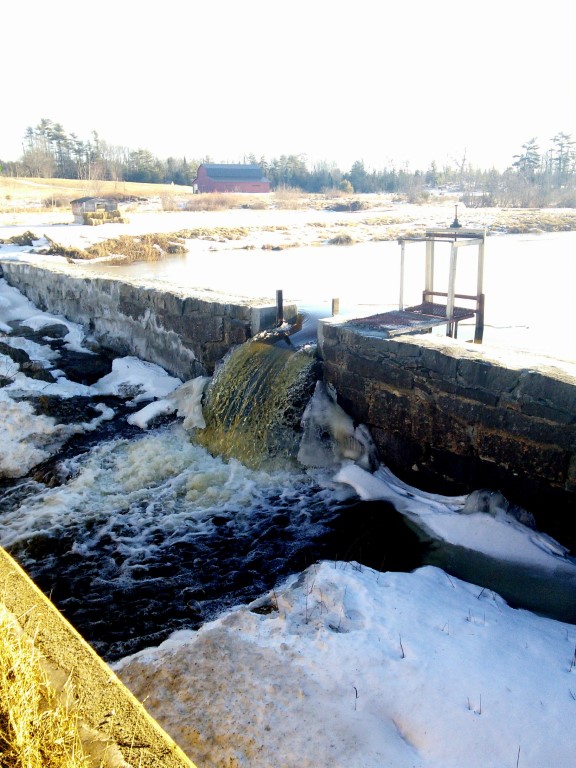
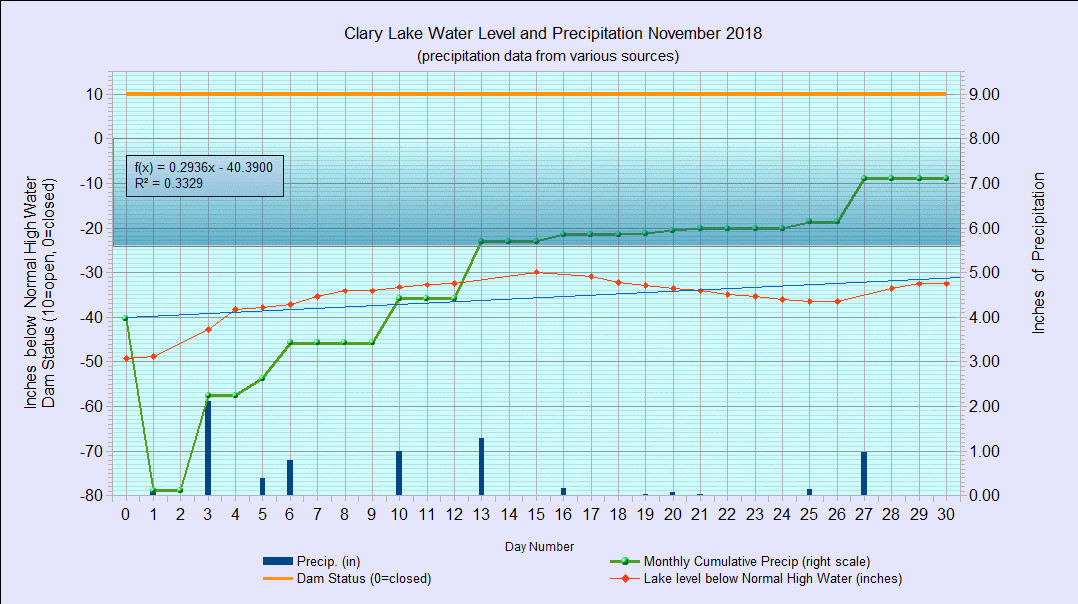
All this rainfall has also resulted in significant flushing of Clary Lake, well in excess of normal. Since January 1st, the lake’s entire volume of water (7,224 acre-feet) has been replaced almost twice. The inverse of the flushing rate is retention time (how long water stays in the lake) and that figure has decreased to about 92 days. The published “flushing rate” for Clary Lake is 1.81 times per year. We’re going to exceed that value by a significant amount. This will help “wash out” the nutrients currently in the lake, but will also result in more nutrients being brought into the lake. This is why controlling non-point sources of soil erosion and sedimentation is So Important: it doesn’t help replacing nutrient-laden water with more nutrient-laden water.
I expect this current algal bloom to dissipate soon, and it remains to be seen if we’ll have additional algae growth this year. Under the circumstances, I wouldn’t be surprised. It is important to remember that even though the dam has been repaired and the lake level restored, the ecology of Clary Lake has been severely damaged as a result of the 8 years of low water and it going to take some time to recover. Clary is still at-risk from both natural and man-caused issues and deserves our ongoing attention.