Category Archives: Technical Lake Stuff

19 December 2020: Clary Lake Frozen Over

Clary is fully iced over as of December 19th.

After consulting with the two Davids (David Hodsdon and David Knight) we’ve concluded that Clary has finally iced over but it will likely at least partially melt off again on Christmas day as we’re expecting a storm bringing an inch or more of rain with temps in the 50’s. Time will tell! As cold as it’s been this month, I expected the lake to freeze before this but heavy rains at the end of November and beginning of December have resulted in a lot of water moving through the lake and as you know, moving water resists freezing. Also, the addition of lots of rain to the lake raises the temperature if only slightly, and this slows down freezing as well. Continue reading

November 2020 Water Level Chart Archived

11 Clary-Lake-Water-Level-November-2020

November 2020

I have archived the November 2020 Water Level Chart (at left). We were a little worried that the fall drought conditions were going to continue into November so we’ve been operating the dam so as to maintain a decent store of water going into Winter, releasing only the required minimum flows. For the first 3 weeks the dearth of rain did continue and the lake level had fallen to 1 foot below the HWM. Then on the 23rd of the month we received over 2 inches of rain and it began to look like we’d end up with well above the normal amount of precipitation for the month. On the last day of the month we received an additional 1.75 inches of rain (glad it weren’t snow!) bringing us to 6.19 inches for the month bringing us to 40.2 inches for the year to date, still 0.42 inches below normal. It’s now Tuesday morning December 1st and it’s still raining and that 0.42 inch deficit is already history, pushing us above average rainfall for the year to date. You’ll find the 2020 Precipitation chart on the Clary Dam Flow Statistics page (along with some other cool graphs). It would appear that the 2020 drought is about over. Continue reading

October 2020 Water Level Chart Archived

10 Clary-Lake-Water-Level-October-2020

October 2020

I have archived the October 2020 Water Level Chart (at left). October water levels were right about where we want them this time of year- down about a foot, more or less. Substantial rainfall around the middle of the month both signaled the end of severe drought conditions and pushed the lake level to a high of -0.77 feet below the HWM and it’s been falling gradually ever since. We started the month -1.14 feet below the HWM and ended the month higher at -0.89 feet. If you’ll recall, rainfall in September was almost nonexistent until the very end of the month. October started off with minor rain events until the 13th of the month when we received 2.44 inches in one storm. We ended up with 5.48 inches of rain for the month, 1.03 inches more than October average of 4.58 inches. Nonetheless, ground water supplies are still below normal as those of you with dug wells are well aware. As of the end of the month, our part of Maine remains in severe drought. We’re 2.01 inches below the yearly average for this date. Continue reading

September 2020 Water Level Chart Archived (edited)

9 Clary-Lake-Water-Level-September-2020

September 2020

I have archived the September 2020 Water Level Chart (at left). September water levels were characterized by a leisurely drop over the course of the month from a high of -0.89 feet at the start of the month to a low of -1.14 feet at the end. On average the water level in August was 0.3 feet (3.6 inches) lower than it was last August. The real news in September were the severe drought conditions that have persisted (and worsened) for the entire month. We started the month slightly ahead of the yearly average and received only 0.10 inches of rain on September 1st and no more rain until storms on the 28th and 30th. That’s 25 days without a drop of rain. We ended the month with a total rainfall of only 0.74 inches, fully 3.10 inches shy of the monthly average of 3.84 inches. For the year we’re 3.04 inches below average for this date. We’re heading into October with a severe deficit of rain. Hopefully that will change soon.


August 2020 Water Level Chart Archived

8 Clary-Lake-Water-Level-August-2020

August 2020

I have archived the August 2020 Water Level Chart (at left). August was characterized by extremely dry and and extremely hot weather which lead to considerable lake water loss due to evaporation. The anticipated influx of runoff from tropical storm Isaias at the beginning of the month never materialized, so our efforts to create a little headroom for storm water runoff only resulted in lowering the lake level two and a half inches, not that anyone noticed! From that level (-0.65 feet below the HWM) the lake level fell steadily at the rate of about 1/4 inch per day until a series of popup thunderstorms starting on August 24th brought some much needed rain to the area that helped keep the lake level from falling further. The lake ended up at -0.90 feet below the HWM. Historically, the water level in Clary would never have been this high in August. Continue reading

02 August 2020: July Water Level Chart Archived

7 Clary-Lake-Water-Level-July-2020

July 2020

I have archived the July 2020 Water Level Chart (at left). For the third month in a row we’ve managed to maintain a relatively stable water level despite mild drought conditions prevalent at the start of the month. The lake level fluctuated only 1.5 inches from low to high over the course of the month, starting out at -0.50 feet and ending the month with the lake level at -0.41 feet. A number of people have let us know that they think the lake level this summer has been about perfect. We were shy of the monthly average rainfall until two back-to-back squalls on July 30th dumped a little over an inch of rain and pushed our monthly rainfall total to 3.77 inches, a little over the average for July of 3.54 inches. Because of an extra dry June, we’re still 0.28 inches below average for this date.

Tropical storm Isaias is due to pass through Maine this coming Tuesday night into Wednesday, and it has the potential of dropping several inches of rain, if not more. We’ve temporarily increased outflows so as to create a little head space to accommodate the anticipated storm water runoff. We don’t expect any significant flooding or a major change in the water level when it’s all said and done. Continue reading

June 2020 Water Level Chart Archived

6 Clary-Lake-Water-Level-June-2020

June 2020

I have archived the June 2020 Water Level Chart (at left). For the second month in a row, the most notable thing about the chart is how relatively stable the water level was especially in light of how little rain we received! Total water level variation for the month was only 0.18 feet (2.2 inches), starting out the month at -0.37 feet below the HWM, falling to a low of -0.55 feet on the 27th, and finally ending the month a little higher at -0.50 feet below the HWM thanks to some much needed rain. Keep in mind that the HWM is actually 3 inches or so ABOVE the lowest point on the dam; for most of the month the lake was pretty much lapping at the top of the dam. We really can’t get more stable than that. Continue reading

May 2020 Water Level Chart Archived

5 Clary-Lake-Water-Level-May-2020

May 2020

I have archived the May 2020 Water Level Chart (at left). The most notable thing about May was how stable the water level was, hovering right around the top of the dam and varying only a little more than 2 inches (0.18 feet) over the course of the entire month. This was by design of course. We started the month at the low of 150.79 feet, hit a high of 150.97 feet on the 22nd, and ended the month at 150.82 feet, only a fraction of an inch higher than we started. This was by design of course: the WLO specifies that after ice out in the Spring we should raise the lake to it’s “full capacity” and keep it as close to that level as possible through the end of July. We consider the lake is at “full capacity” when the water is lapping at the top of the dam, despite the fact that the elevation of the “High Water Mark” is roughly 3 inches higher; we obviously can’t be expected to maintain a lake level where water is running over the top of the dam. Continue reading

April 2020 Water Level Chart Archived

4 Clary-Lake-Water-Level-April-2020

April 2020

I have archived the April 2020 Water Level Chart (at left). The most notable thing about April (aside from the cold weather!) was the excessive rainfall we received which resulted in a short but intense period of extreme high water. Two back-to-back storms on the 9th and the 13th dropped a total of 3.65 inches of precipitation. In addition to a good charge of rain, the first storm also included about 8 inches of very heavy wet snow which completely melted during the second weather event, which was all rain. The resulting runoff from both storms caused the lake level to rise quickly, cresting at 151.75 feet or fully 0.58 feet above the High Water Mark, by far the highest we’ve seen the lake in a long time. The last time I saw more water going over the dam was during the Patriot’s Day storm back in 2007. According to our Dam Operation Log total outflows peaked around 230 cubic feet per second. We hurriedly opened the gate all the way the day before the storm and left it open for 5 days to help drain off some water, and the lake level quickly returned to where we want it this time of year: at or very close to the top of the dam.

We received a total of 6.25 inches of precipitation in April, fully 2.38 inches more than the monthly average of 3.87 inches. This brings us to 16.14 inches for the year to date or 2.70 inches more than the average of 13.44 inches. We’ll see if this trend keeps up in May.

Here are a few pictures from the April 14th high water event:


04 April 2020: Clary Lake Full Once Again

20200404_114344A few days ago when I posted about archiving the March water level chart I said I expected the lake would fill soon, but that was before we received heavy rain on Thursday and Friday. That did the trick! This morning the lake had risen to an elevation of 150.96 feet and water was just beginning to flow over the top of the dam (picture at left). What a pleasant sight! While the current lake level is still 0.21 feet below the HWM, I consider the lake to be full when water is just beginning to flow over the top of the dam. Dave Knight and I went over this morning and installed the 6th and final stop log and opened the gate just a wee bit to tweak the outflows. Our goal now will be to maintain this water level (or close to it) through the end of July. The current minimum flows of 35.9 cfs drop to 8.3 cfs on May 16th.

03 April 2020: Clary Lake is Featured Lake on Lakes of Maine Website

Lake Stewards of Maine maintains several great websites including the Lakes of Maine site which provides detailed technical information about most lakes in Maine, including Clary Lake. They also feature a different Maine lake on their website every month including a picture and a brief write up about the lake. April’s Lake-of-the-Month is Clary Lake! The picture they’re using for Clary Lake was taken by David Hodsdon. Another cool site maintained by Lake Stewards of Maine is the Near Real Time Lake Data site.


March 2020 Water Level Chart Archived

3 Clary-Lake-Water-Level-March-2020

March 2020

I have archived the March 2020 Water Level Chart (at left) which for what it’s worth was labeled “Clary Lake Water Level February 2020” for the entire month of March due to an oversight on my part. Hope nobody was confused about what month it really was! The remarkable thing the March water level chart reflects is the relatively stable water level that lasted through the whole month, hovering right around 1 foot below the HWM for most of the month. Normally, long about the middle of March precipitation and rising temperatures cause the snow to start melting, and runoff starts to increase which usually more or less coincides with the change in minimum flows from the wintertime rate of 11.3 cfs to the springtime rate of 35.9 cfs. It’s about mid-March that we start to install some stop logs in the weir to start raising the lake level while at the same time opening the gate to produce the higher outflows required by a the change in minimum flows. This year however there wasn’t any snow to melt so that big charge of runoff that Continue reading

February 2020 Water Level Chart Archived

2 Clary-Lake-Water-Level-February-2020

February 2020

I have archived the February 2020 Water Level Chart (at left). The lake level was pretty sedate for most of the month, falling slowly and steadily from a high of -1.09 feet at the beginning of the month to a low of -1.52 feet on the 27th. On that date we received an inch of rain which melted a good deal of our snow pack and brought the lake up almost half a foot by the end of the month.

That last rain event brought our monthly precipitation total to 3.19 inches, 0.58 inches more than the February average of 2.61 inches. For the year to date we’re already 0.39 inches above average. The dam’s control structures (weir and gate) remained unchanged for the whole month with the gate open about 4″ and no stop logs in the weir. Minimum flows will rise from the current 11.3 cfs to 35.9 cfs on March 15th at which time we’ll open the gate some more to provide the increased outflows, and will probably start adding stop logs to the weir to start raising the lake level to normal spring levels. Continue reading

January 2020 Water Level Chart Archived

1 Clary-Lake-Water-Level-January-2020

January 2020

I have archived the January 2020 Water Level Chart (at left). Not a lot to say about this chart! The lake level remained a little higher than we want it this time of year, but not outrageously so. We’ve been trying to keep it down around -1.50 to -1.75 feet below the high water mark; the actual level has fluctuated from a low of -1.52 feet and a high of -1.09 feet, a range of only 0.43 feet. We received 3.00 inches of precipitation, a little shy of the average for January of 3.19 inches. Much of the precipitation was in the form of rain. Not a lot of snow out there.

02 January 2020: The Winter 2019 Water Column Issue Is Out

The Winter 2019 Lake Stewards of Maine’s periodical “The Water Column” arrived in our mailbox today. As usual, it’s full of interesting information about the state of lake water quality monitoring in Maine, invasive plant problems around the State, and other issues impacting lakes in Maine.

Last year’s Winter 2018-2019 issue of The Water Column was all about the impact of climate change on Maine lakes, and this winter’s issue continues their coverage of climate change with an interesting article on ice-in and ice-out trends. The Lake Stewards of Maine does a great job of publicizing their activities. The Clary Lake Association has been conducting water quality monitoring on Clary Lake in association with the Lake Stewards of Maine (formerly the Volunteer Lake Monitor Program or VLMP) since 1975 and is a long time supporting member of their organization.

https://www.lakestewardsofmaine.org/mediaresources/the-water-column/

Here’s a link to the full document:

The Water Column Winter 2019

December 2019 Water Level Chart Archived

12 Clary-Lake-Water-Level-December-2019

December 2019

And 2019 is a wrap! I have archived the December 2019 Water Level Chart (at left). The most interesting thing about the December chart is once again, how much precipitation we received. It’s been a wet year and December was no exception. It still amazes me how much water can flow into- and out of- Clary Lake in a relatively short period of time. More on that later. In addition to the monthly chart I’ve also archived a bunch of other charts including the 2019 whole-year chart, the 2019 flows chart, the 2019 precipitation chart, and by the time I’m done probably a few more charts as well. You’ll find ALL of them in the 2019 Water Level Charts archive. I love charts. Does it show? Continue reading

17 December 2019: Clary Iced-In For The 3rd Time! [UPDATED]

Clary-frozen-12-17-2019Clary Lake has had a hard time staying frozen this year! It initially completely froze over on December 4th and remained well frozen for a week. Then warm temperatures and heavy rains caused it to mostly open up again on December 11th. It had completely refrozen by the next day December 12th, only to completely melt off again on December 15th! This morning, as you can see on the composite photograph of the 3 Clary Webcams, it appears completely refrozen with the possible exception of a small sliver of open water over on the east end of the lake. This afternoon’s expected snow fall will show if that’s really the case. Perhaps this is it. I don’t see anything in the forecast to suggest the lake will melt off again, but you never know.

While December 4th is early for ice in, historically it’s not particularly early at all. I recall as a kid ice skating on Clary Lake at Thanksgiving. Visit our Ice-In and Ice-out dates for Clary Lake page. We have records available back to 2001.

20191217_141327-Large[UPDATE] I guess I wouldn’t be calling the lake fully frozen just yet, judging from the amount of water that’s leaking up onto the surface. When it first started snowing today, dozens of small wet spots appeared. As the snow continued, the wet spots grew in size and number. There must be small holes in the ice for this to occur. Perhaps a good hard freeze will finish the ice-in process!

November 2019 Water Level Chart Archived

11 Clary-Lake-Water-Level-November-2019I have archived the November 2019 Water Level Chart (at left). The most notable thing the November chart shows is nothing much! We got a lot of rain (3.75 inches), but not as much as in a normal November (4.58 inches), the month with the highest rainfall on average. We were hoping to keep the lake level around 1 foot below the HWM without overspending our water budget and we did mostly OK until a series of rain storms in the latter half of the month brought the lake level back up to within less than 1/2 foot of the top of the dam. Rather than overspend our water budget, we ended up with water in the bank so to speak. Not really a problem, but not what we were looking for. We ended the month only a 10th of a foot or so lower that we started. We’re currently letting out close to 60 cfs in an attempt to drop the lake to a more normal level for this season. Continue reading

October 2019 Water Level Chart Archived

10 Clary-Lake-Water-Level-Precipitation-October-2019

October 2019

I have archived the October 2019 Water Level Chart (at left). The most notable thing the October chart shows is Holy Hannah did we get a lot of rain 🙂 We started the month 0.85 inches BELOW average and ended the month just shy of 3 inches ABOVE average for this date. All told we received 8.28 inches of rain in October whereas average rainfall for October is a “only” 4.45 inches. We received almost twice that. We’re now at 39.02 inches for the year, just 5 inches shy of what we’d expect to receive for the whole year, and we still have 2 months to go (see Precipitation chart below). All that rain complicated our efforts to draw the lake down this fall, and currently the water level sits at around 0.60 feet below the HWM, give or take- a level more appropriate for mid to late Summer. Continue reading

15 October 2019: CLA’s Water Quality Monitoring Team Wraps Up Another Season

David-Kelsie-George-10-13-2019
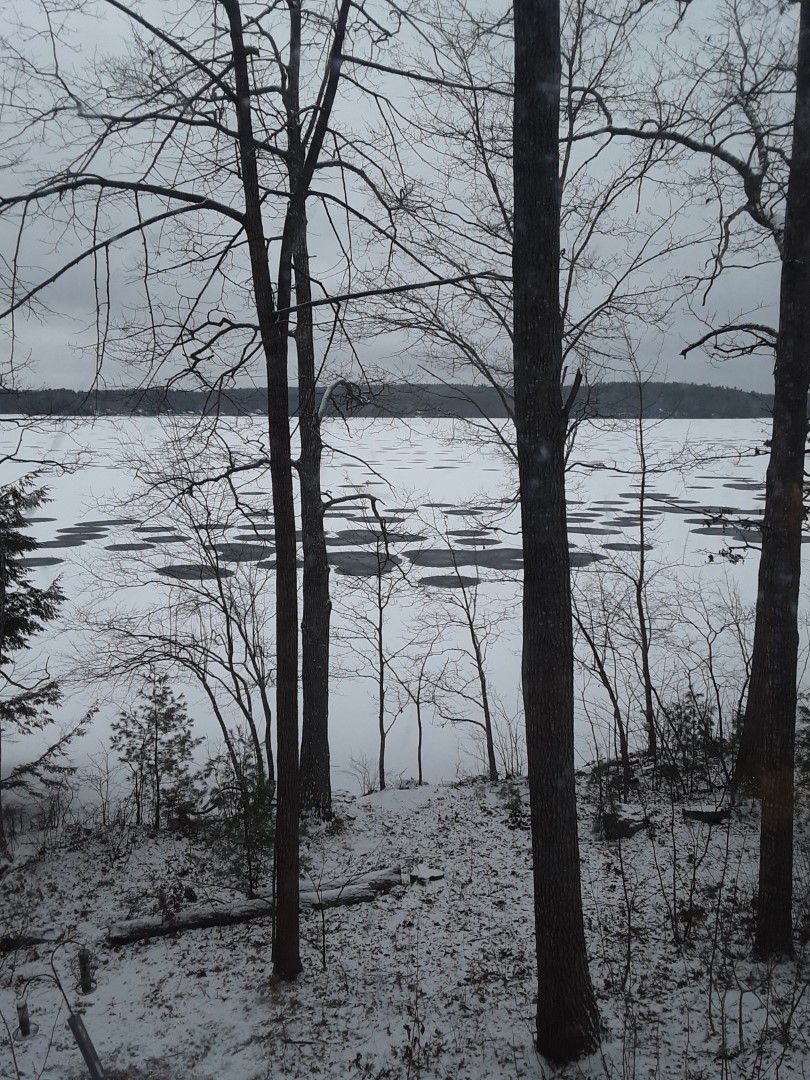
We’ve wrapped up another season of water quality monitoring on Clary Lake and took this selfie to celebrate. For David Hodsdon, this completes his 44th year of water quality monitoring (he started in 1975!). For Kelsie French it is her second, and for me, my sixth. Jack Holland also helps out when he can. I think he’s been doing it for close to 20 years. We’ve got a good team doing good work.

Clary’s water quality this past summer was better than what we’ve come to expect in recent years despite a mid-summer high Phosphorus reading of 0.028 mg/liter (the 4th highest we’ve ever recorded). That’s considerably higher than we’d like to see it. The high P sample was likely attributable to the 15″ of rainfall we received in April, May, and June as runoff from rainfall is the primary source for Phosphorus. We did see a small burst of cyanobacteria growth no doubt in response to the high P in the lake water, but it dissipated quickly and didn’t raise any real concerns. The results of our last Phosphorus sample (we take 3 samples per season) taken on September 27th) aren’t back from the lab yet. We’re hoping it shows improvement.

Clary Transparency

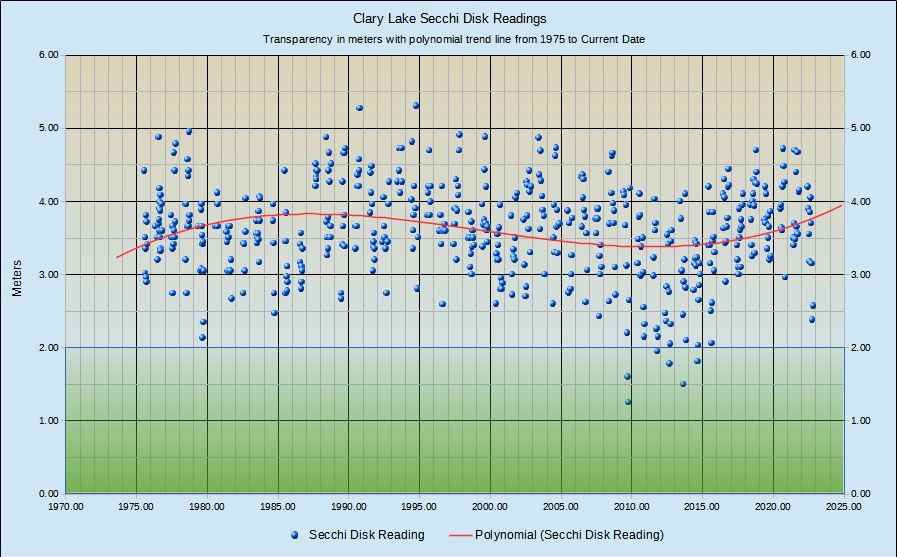
The average of 13 transparency readings over the summer was 3.6 meters (11.8 feet) which for Clary is Great! Transparency never fell below 3.15 meters (10.3 feet) and got as high as 4.20 meters (13.8 feet) in early May. You can see on the chart of secchi disk readings at left that overall transparency in 2019 easily bucked the historical downward trend we’ve seen during the years of our water level crisis. We expect our newly restored water level regime will result in good water quality going forward, but we’ve got to remain vigilant. Lakes are fragile ecosystems and many issues can affect water quality.

Here’s a link to our water quality monitoring data going back to the beginning of 2012. Historical data is available upon request: