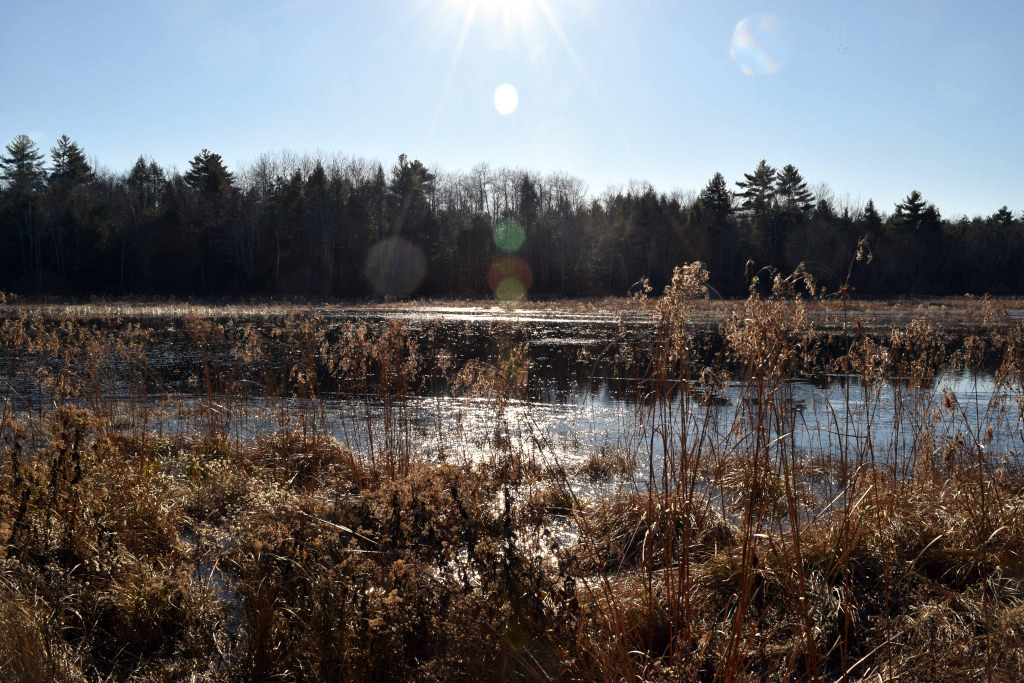
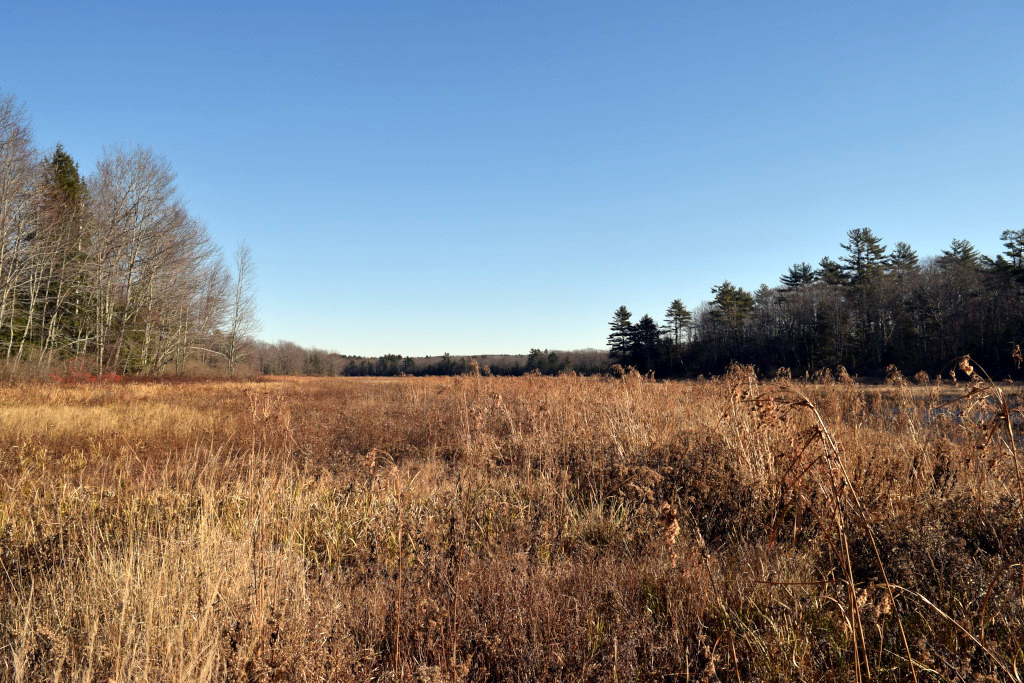
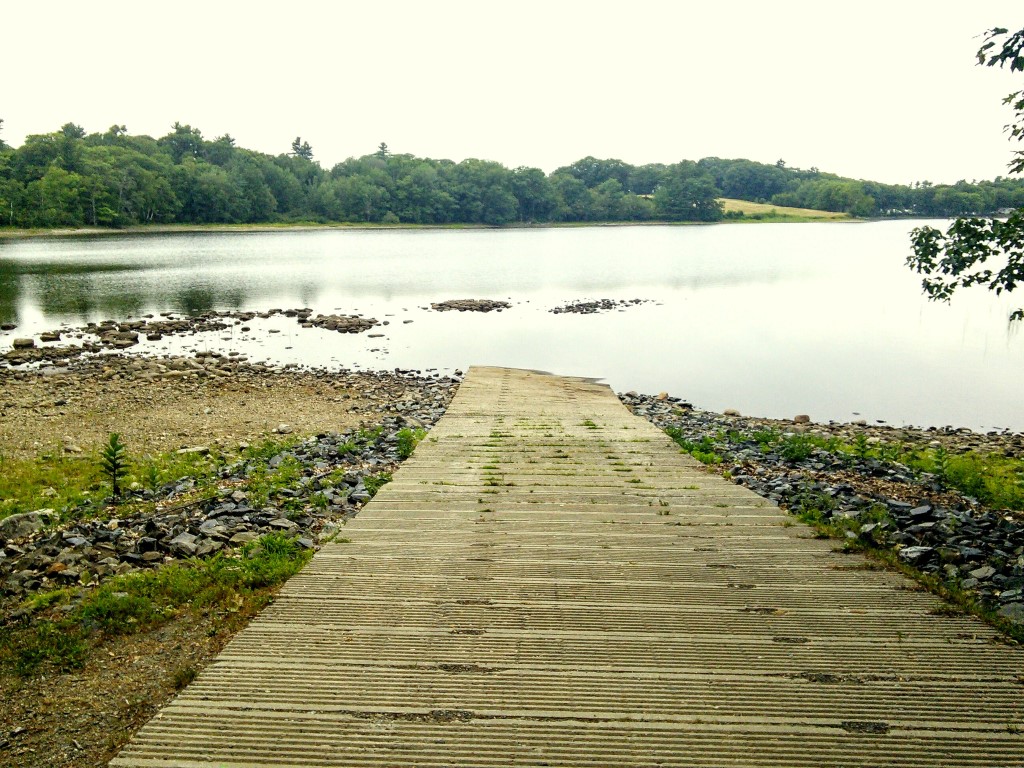
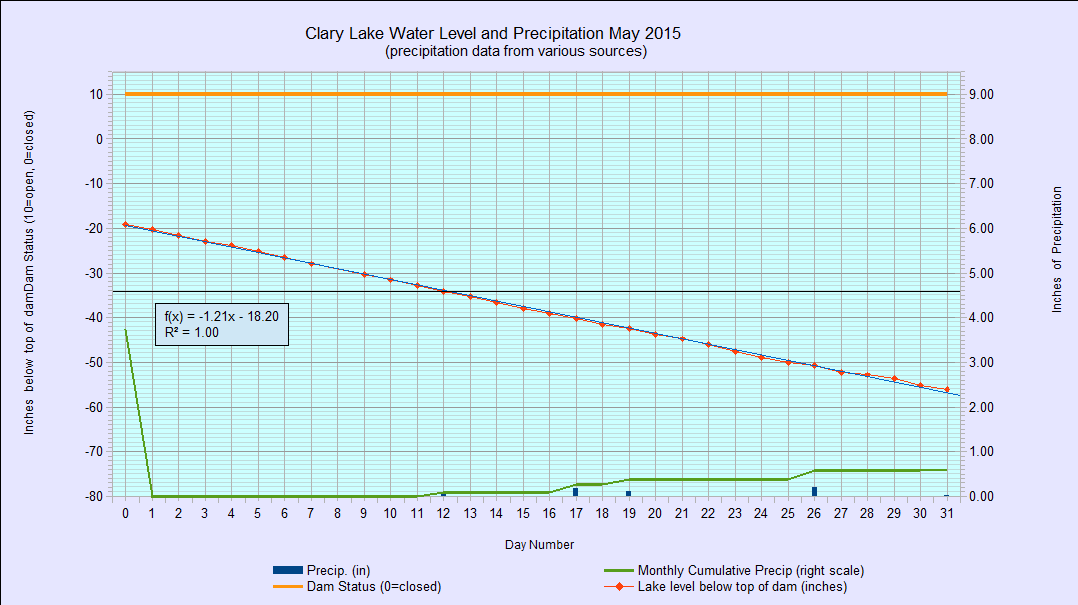
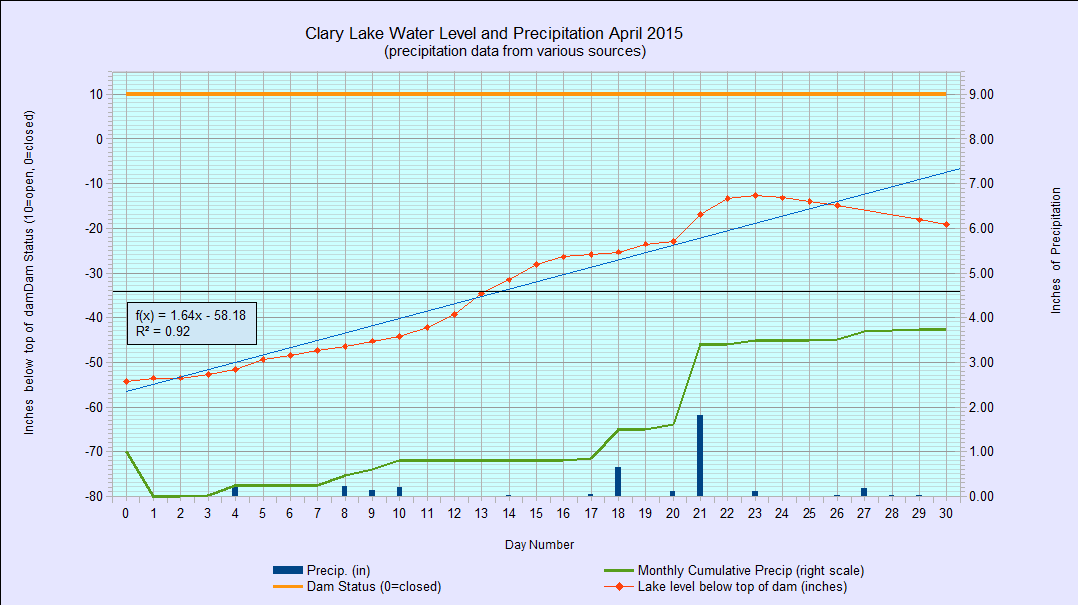
 Ice conditions on Clary Lake this winter are pretty strange and I can’t say as I’ve ever seen anything quite like what is happening this year. Currently there is about 7″ of ice on the lake but due to a combination the falling lake level (it’s fallen about 15″ since freezing up), recent snow, and January thaw temperatures, much of the lake is covered by 2″ to 4″ of water on top of the ice. This results in a slushy mixture which adds considerable weight to the ice, pushing it down and forcing water up through holes and cracks in the ice. I probably wouldn’t have been out on the lake in the first place except I saw my neighbor and a friend out setting ice fishing traps using his snow mobile to haul their gear. I decided to walk out and say hello, which is when I encountered the bubbling “spring” in this video:
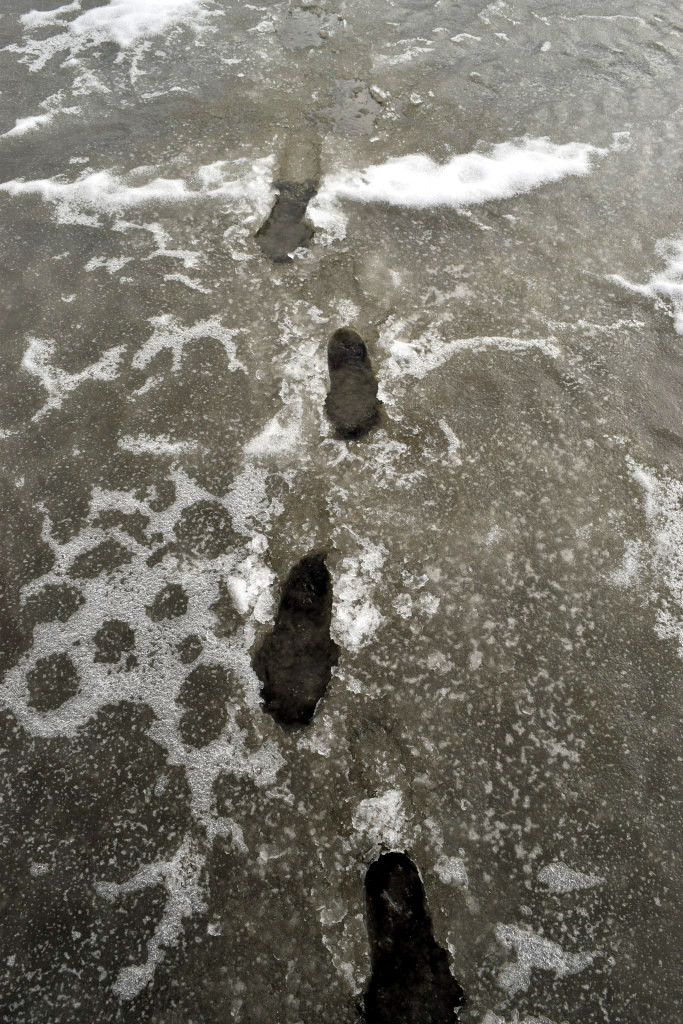
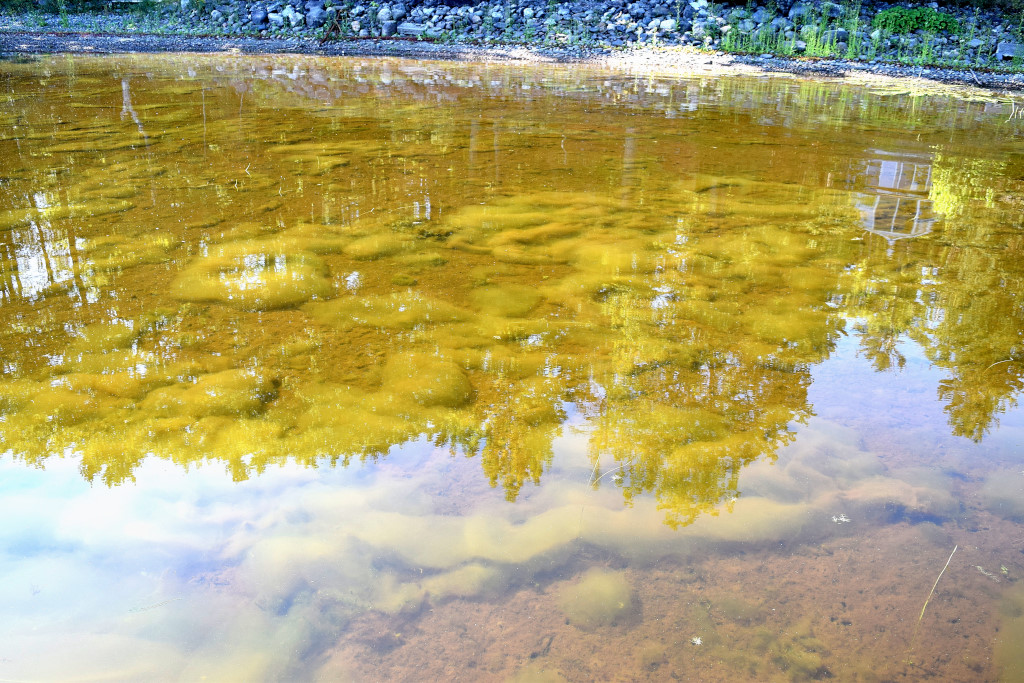
What you’re looking at is lake water bubbling up through 4″ of slush from a 1″ diameter hole in the ice. Very disconcerting.
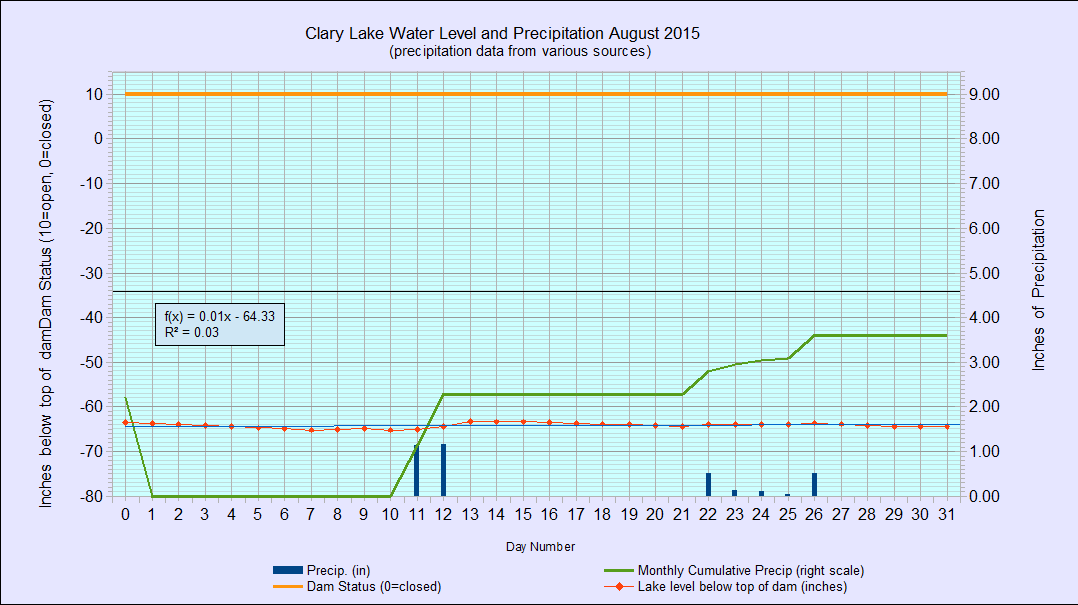
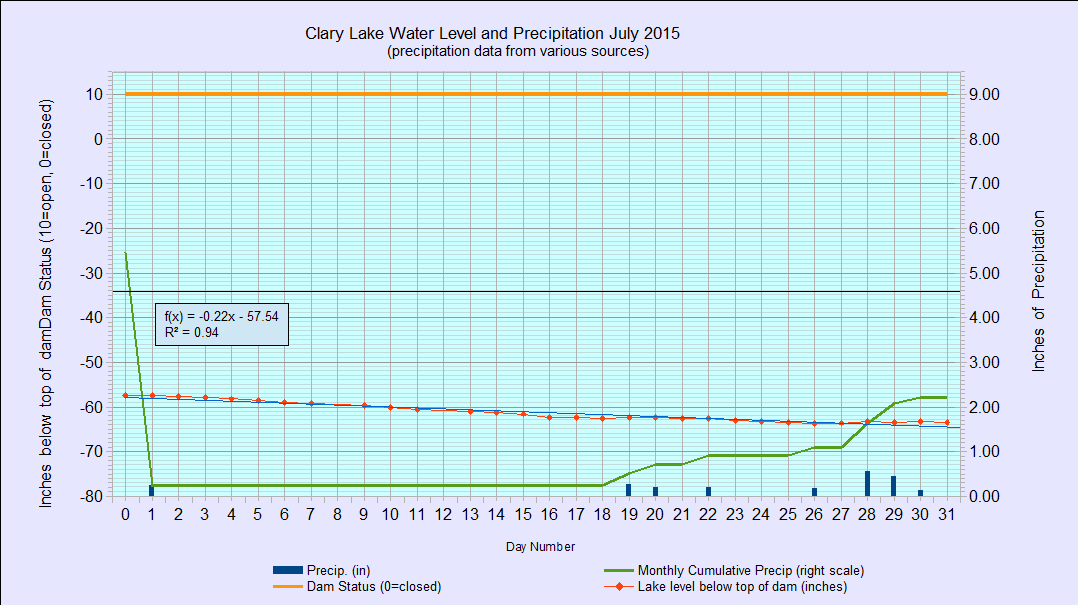
While the ice seems solid enough, it is disconcerting to say the least to be walking along on what appears to be a solid surface and then suddenly breaking through the crust to find yourself standing in 4″ of water. I would advise you use caution if you plan to venture out on the ice, and make sure to check the thickness frequently. Remember, because the dam’s gate is wide open, there’s a current flowing towards the channel which can result in thin ice in places. You were warned.

 I’ve
I’ve 