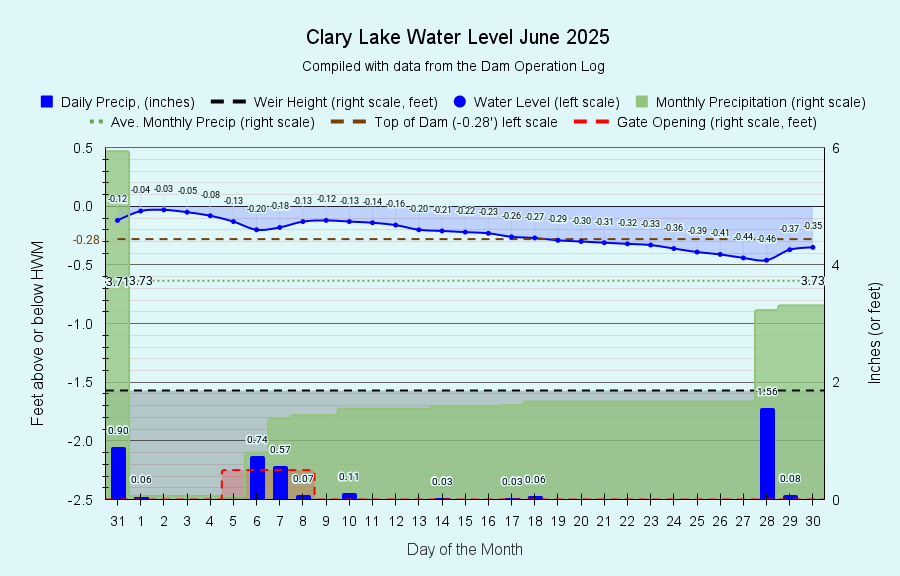
I have archived the June 2025 water level chart (above, and at left). After 3 months of more than average rainfall, it looked like precipitation in June was going to fall well short of normal with nearly three dry weeks with only occasional smidgens of rain falling. Then two days before the end of the month we received a whopping 1.56 inch deluge, most of it in just the last few hours. This and a wee bit more rain the following day brought us to 3.31 inches for the month, only 0.42 inches short of the June average 3.73 inches. We’ll call it good. The dry conditions for most of the month resulted in a gradual decline in the lake level with roughly 2/3 of the water loss due to evaporation and only about 1/3 of it resulting from leaks. This is normal during dry summer weather.
Evaporation
Measuring lake water evaporation is a bit of a guessing game. Air temperature, water temperature, wind velocity, barometric pressure, and relative humidity (and probably a few more things I’m forgetting just now) are all factors in how fast or slow evaporation takes place, and coming up with a formula that spits out anything like a reasonable answer is not easy! We take a relatively simple approach to the problem, we really only want to know how much of a drop lake level is attributable to evaporation. That makes it easier: we start first by calculating outflows (including an estimate of leakage) and then calculating how much the lake level should drop after losing that much water and comparing that with how much the lake actually fell. If outflows should drop the lake 0.01 feet 24 hours but the lake actually dropped 0.03 feet in that time, then it is reasonable to assume the difference (0.02 feet) was lost through evaporation. It isn’t exact, but it’s close enough. You’ll find this another other fascinating data on our Dam Operation Log.
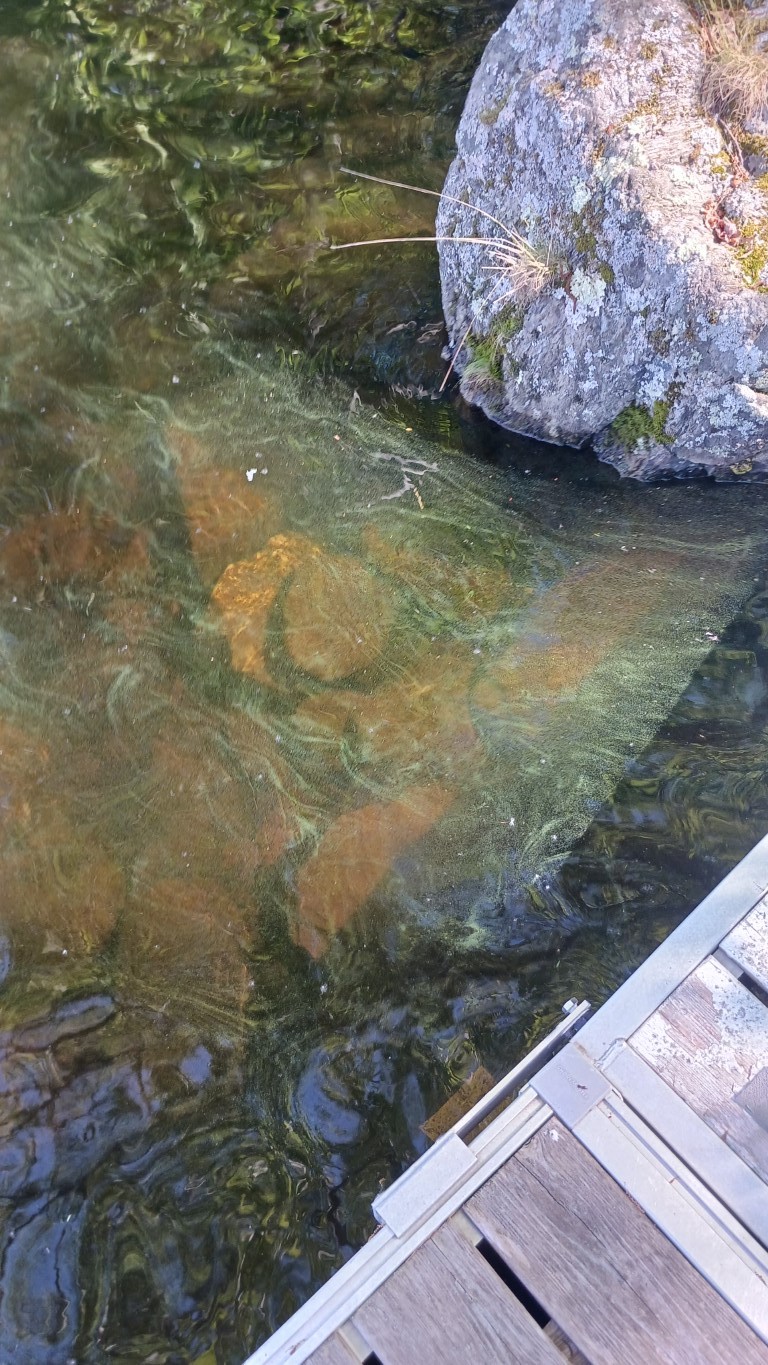
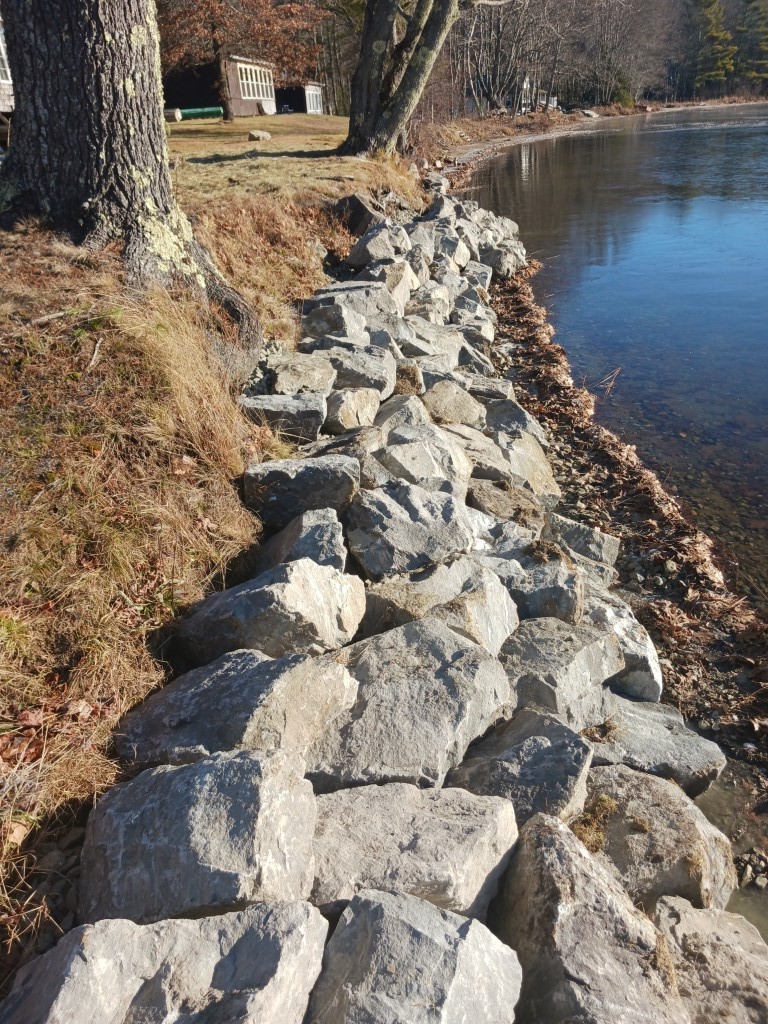
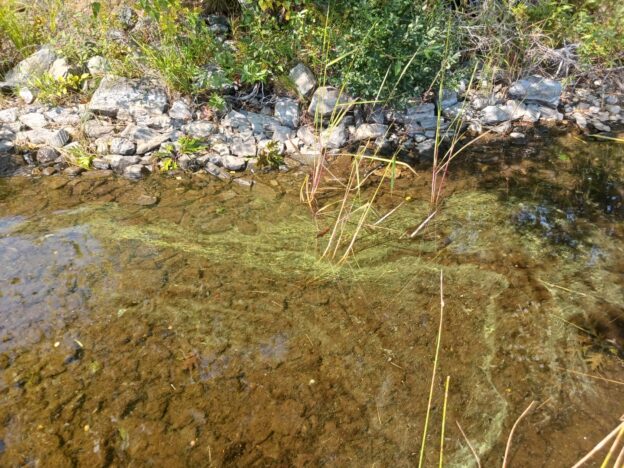
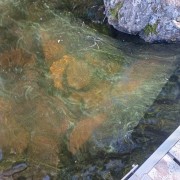 Lake water quality is improving thanks in part to the dry weather in June. Heavy rain in March, April, and May washed a lot of sediment and other nutrients into the lake resulting in a mild infestation of blue green algae and a transparency reading of 3.19 meters (10.5 feet) on May 18th. Most people probably didn’t even notice the algae die off at the end of May (picture at left). Thankfully it was pretty mild and short lived. Kelsie French and I conducted our 4th water quality monitoring session yesterday and found transparency greatly improved with secchi disk readings between 3.85 and 4.0 meters. See our Clary Lake water quality data page for more information.
Summer is here folks! Get out and enjoy Clary Lake!

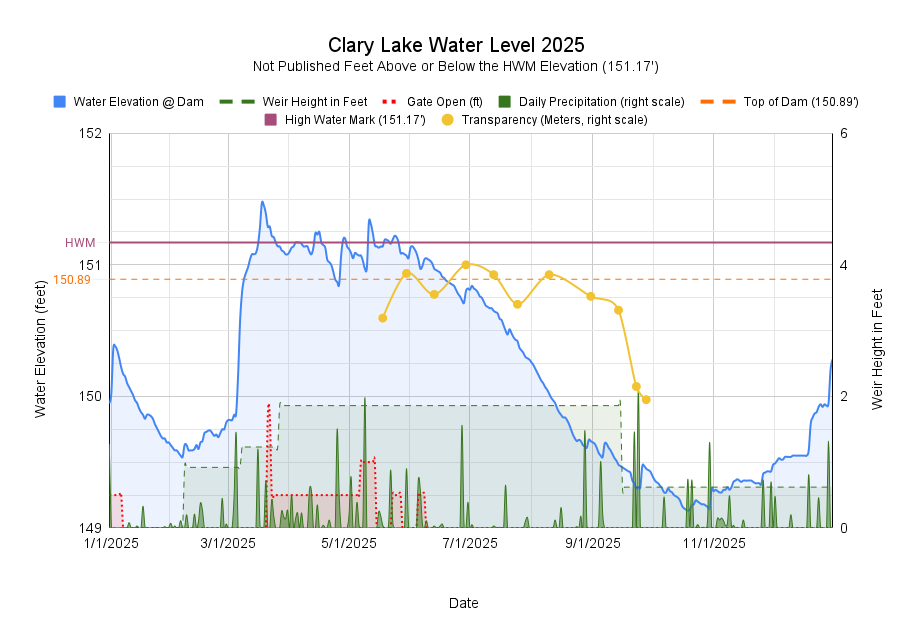
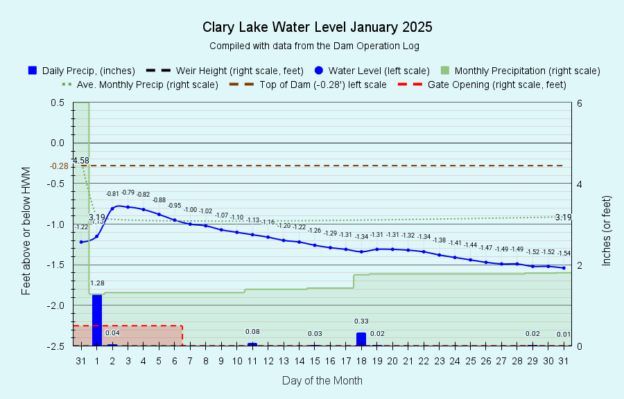
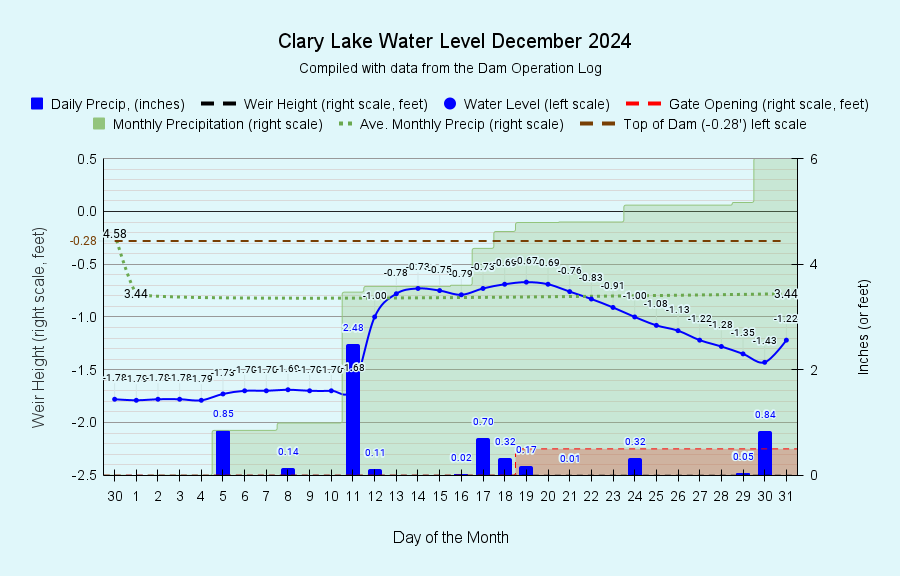
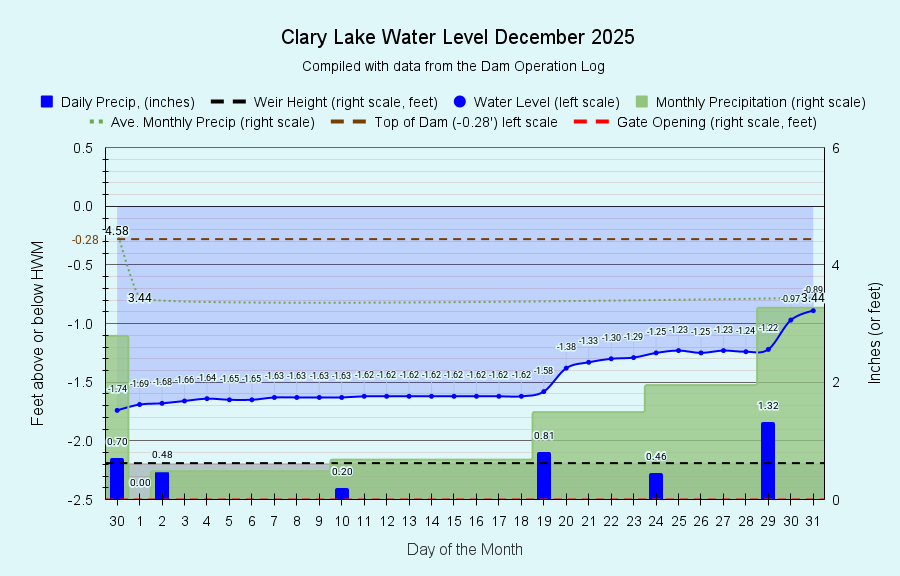 And so we come to the end of another year. I have archived the December 2025 water level chart (above, and at left) and also updated the 2025 Water Level Charts gallery with all the relevant 2025 charts for Clary Lake (and probably a few irrelevant ones as well) showing the year in numbers: lake level, transparency, dissolved oxygen, temperature, rainfall, flushing rate and retention time, etc. I do hope you’ll take some time to review the charts.