
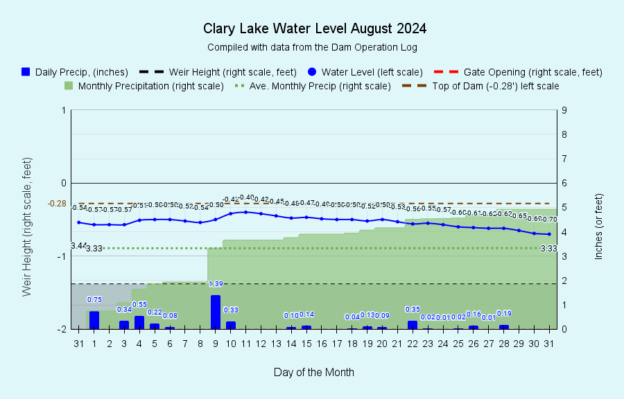

I have archived the August 2024 water level chart (above, and at left). This is typically the time of year when drought takes over and evaporation controls the lake level but we actually received enough rain in August to mostly offset water loss from evaporation and leakage. We started the month with the lake level down -0.54 feet and ended the month down only -0.70 feet for a net loss of 0.16 feet or 1.9 inches. What’s more, the average rainfall from any given storm was only a quarter of an inch so we didn’t have any large, fast storms which would have washed sediment into the lake. The upside is it helped our water quality remain high while still getting enough rain to keep things green but the downside is it did seem like it rained all month. In fact, we got some amount of rain on 19 of the 31 days of the month so it might have seemed like we got more rain than we did. As for rainfall, we ended the month having received 4.92 inches of rain, only 1.59 inches more than normal but for the year, we’re at a whopping 40.56 inches of precipitation or fully 12.81 inches MORE water than is normal for the end of August.
Record Water Clarity!
![]() The real news this summer has been the ongoing record water clarity driven by a high flushing rate, high water table, and record low Total Phosphorus numbers. This trend continued spectacularly in August. We measured lake transparency twice in August and both readings were over 5 meters and the two core water samples we took for Total Phosphorus testing this summer both came back at 0.012 mg/L (milligrams per liter). We took another core water sample in early August but we haven’t received those results yet. I’m sure when we do they’ll be low as well. To put all this in perspective, we can literally count on the fingers of one hand the number of 5 meter or greater secchi disk readings we’ve seen going back to 1975 (see chart at left) and only once back to 1975 did we have a lower TP number (0.011 mg/L on August 1st, 1993). We started the year on May 5th with a secchi disk reading of 3.55 meters and it’s been getting steadily deeper all summer. This really is a remarkable clarity trend.
The real news this summer has been the ongoing record water clarity driven by a high flushing rate, high water table, and record low Total Phosphorus numbers. This trend continued spectacularly in August. We measured lake transparency twice in August and both readings were over 5 meters and the two core water samples we took for Total Phosphorus testing this summer both came back at 0.012 mg/L (milligrams per liter). We took another core water sample in early August but we haven’t received those results yet. I’m sure when we do they’ll be low as well. To put all this in perspective, we can literally count on the fingers of one hand the number of 5 meter or greater secchi disk readings we’ve seen going back to 1975 (see chart at left) and only once back to 1975 did we have a lower TP number (0.011 mg/L on August 1st, 1993). We started the year on May 5th with a secchi disk reading of 3.55 meters and it’s been getting steadily deeper all summer. This really is a remarkable clarity trend.
2024 Dissolved Oxygen Profiles
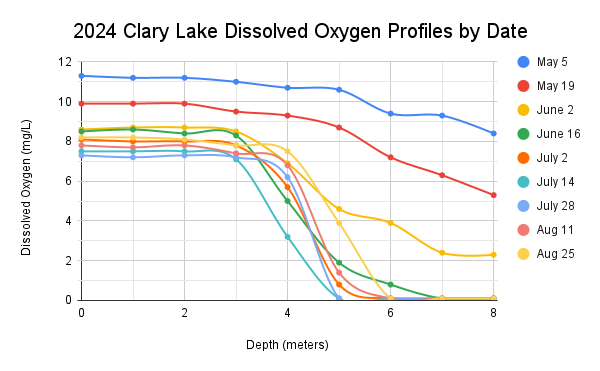 The temperature and dissolved oxygen profiles this summer look about what you’d expect for a moderately productive Mesotrophic lake like Clary. The chart at left shows dissolved oxygen (DO) profiles for each water quality monitoring session we conducted so far this year, starting with the top blue line on May 5th showing good O2 saturation top to bottom, just what you’d expect that time of year. Profiles taken every 2 weeks show a consistent trend of falling DO levels due to warming water temperatures (warm water holds less DO than cold water). The top 3 meters of the lake remain well mixed by wind and wave action with plenty of DO down to 3 meters all summer, but below 3 meters DO starts to drop significantly and by mid-June, DO has fallen to less than 1 mg/L at 6 meters. By mid-July, there’s virtually no DO to speak of below 5 meters. This oxygen deficient environment at the bottom of the lake results in a chemical process taking place whereby Phosphorus and iron in the bottom sediments react resulting in Phosphorus re-entering the water in a process known as “internal loading.” When fall winds and cooling water temperatures cause the lake to turn over and mix again, this Phosphorus rich water mixes with the upper surface water where algae live and sunlight can reach. An algal bloom usually results.
You’ll find both DO and Temperature profile charts (and more!) on our Clary Lake Water Monitoring Data page.
Clary’s Trophic State
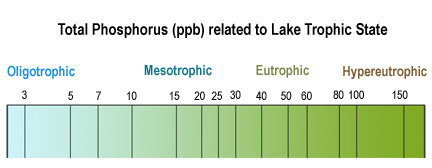
The ability of a lake to support plant and animal life defines it’s productivity, or trophic state. Productivity is largely driven by Phosphorus, and it follows that the more Phosphorus is available for plants and animals, the more productive that lake will be. The diagram at left shows the relationship between Total Phosphorus (TP) levels and trophic state. Clary Lake is a Mesotrophic lake based on our average TP level. The oxygen depletion that occurs in all lakes but primarily in Mesotrophic lakes and Eutrophic lakes is due to the decomposition of algae and other organisms that die and sink to the bottom of the lake.
While Total Phosphorus is the best measure of lake productivity, at $45 per test it’s expensive. Another way to get a measure on lake productivity is by measuring the conductivity of lake water and this can be done quickly and easily with an under $100 Conductivity tester. We have such a device and we’ve been measuring lake water conductivity since late 2022. I’ll discuss lake water conductivity at year end. It’s Labor Day weekend and it’s time to go fishing!
It remains to be seen if we’ll have an algal bloom this fall. It’s certainly possible, even likely, but I’m wondering, with the water so clear this summer if there is really enough algae in our lake water to develop into a full fledged bloom before cold weather shuts things down, even with the fall turnover adding some Phosphorus to the mix. Time will tell. We’ll no doubt see a drop in transparency but I suspect it will not be pronounced. We’ll be taking a final core water sample for TP testing in mid-September and secchi disk readings through mid-October. It will be interesting to see where those numbers fall.