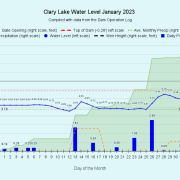
 January 2023
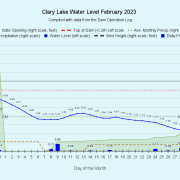 February 2023
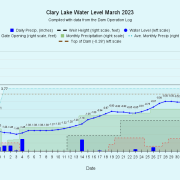 March 2023
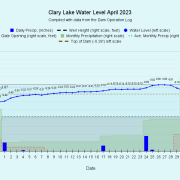 April 2023
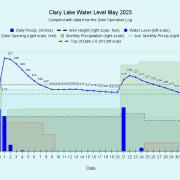 May 2023
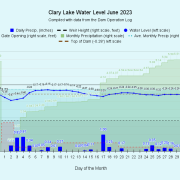 June 2023
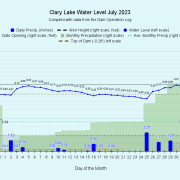 July 2023
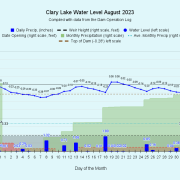 August 2023
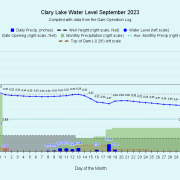 September 2023
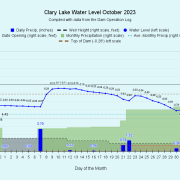 October 2023
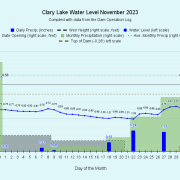 November 2023
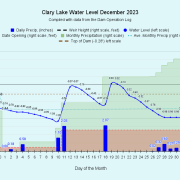 December 2023
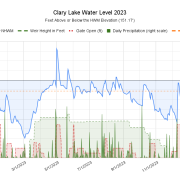 Clary's fluctuating water level throughout the year. Also shows the gate and weir status and precipitation.
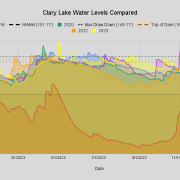 One of my favorite charts. Lake water levels since 2018 superimposed on one chart.
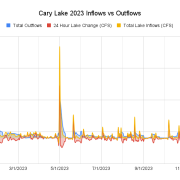 A cool chart showing Clary Lake inflows and Outflows throughout the year. You can see the effect of heavy precipitation in early Winter, during the spring, and in late Fall.
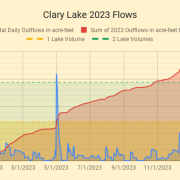 Introduced in 2022, this chart shows total daily outflows (in acre-feet) and the sum of accumulated outflows.
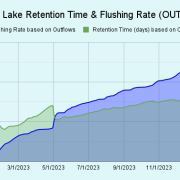 Clary Lake 2023 Retention Time and Flush Rate based on OUTFLOWS from the lake. Differs somewhat from the same statistics using INFLOW data because it doesn't include water that flowed into the lake but hasn't made it's way out yet...
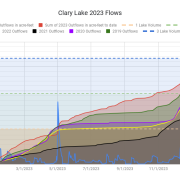 A new addition: This shows compares accumulating outflows in acre-feet plus daily outflows along with lines marking 1, 2, and 3 lake volumes.
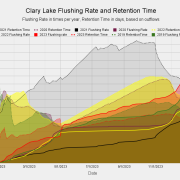 A new chart, introduced in 2023: Flushing Rate and Retention Time are annual statistics, but it's fun and informative to watch them develop over time. This chart superimposes these statistics for recent years. This chart uses the same colors for the years as the above chart of Flows.
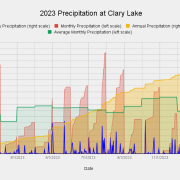 Precipitation showing individual rain events, average monthly rainfall, actual monthly rainfall, and accumulated rainfall.
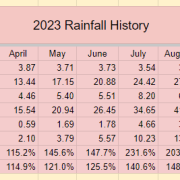 Here's the actual rainfall data for 2023
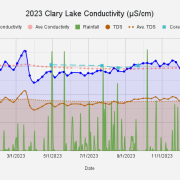 Introduced in 2023: Conductivity, Average Conductivity, Core water Conductivity, Total Dissolved Solids (TDS), average TDS, and rainfall.
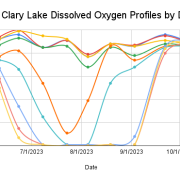 2023 Clary Lake Dissolved Oxygen Profiles by Depth
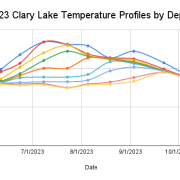 2023 Clary Lake Temperature Profiles by Depth
Other links:
Current Month Water Level Chart
 Chart showing Clary Lake water level variation from December 2011 through May 2019. This chart is no longer being produced.
Like this:
Like Loading...
 Chart showing Clary Lake water level variation from December 2011 through May 2019. This chart is no longer being produced.
 Chart showing Clary Lake water level variation from December 2011 through May 2019. This chart is no longer being produced.